

2018 will be remembered historically for its extremes. From the historical kick start to that will all but certainly ear-mark a market top for a long time to come, to the sharp reversal to year to date lows in the final home stretch, the market in 2018 left most participants scratching their heads in confusion and frustration.
Put into Context
The S&P 500 gained as much as 7.0% in January before closing out the month up 5.6%.
The S&P 500, then fell 15.0% since the close on October 1, but at its trough was down as much as 19.8%.
At one point, the S&P 500 was down 15.0% for the month of December alone.
CONTEXT MATTERS
2018’s jump start came on the back of a strong 2017 which was predominantly fueled by optimism, tax cuts, and a booming world economy. Investors grew “punch drunk” on the notion of repatriation, tax cuts, and stock buyback all with a suppressed fed funds rate.
The central feature of the stimulus plan was an increase in personal income and reduction corporate tax rates, both of which were seen as fuel that would drive a pickup in consumer spending, a pickup in business investment, a pickup in employee wages, and a pickup in earnings growth.
That vision was realized pretty quickly. Only the pickup in some cases, like business investment and employee wages, wasn't quite as strong as forecast. There was a clear pickup in GDP growth in 2018, which averaged 3.3% on an annualized basis over the first three quarters versus 2.5% for the first three quarters of 2017. That pickup was led by increases in personal spending following the implementation of the fiscal stimulus plan. That direct correlation led to a fuel in market chasing for three quarters.
The above mentioned economic momentum translated into a direct revenue and earnings growth momentum for S&P 500 companies that was remarkable.
According to FactSet, the 10.5% increase in second quarter revs was the highest growth since Q3 2011; the 26.0% EPS growth in the third quarter was the highest since Q3 2010; and the 20.3% earnings growth projected for calendar 2018 would be the highest for the S&P 500 since calendar year 2010.
CRASH SUPPORT
The economic and earnings growth momentum helped stabilize the market following a crash in February that culminated with the first 10% correction for the S&P 500 in about two years. That correction happened in just ten trading sessions.
That drawdown got blamed for VIX short sellers who got caught on the wrong side of derivative trades and in a massive unwind. In reality, and hindsight, the market was overextended, but it shifted into overdrive following the release of the January employment report. That report showed a larger than expected increase in average hourly earnings. That increase lit up concerns about the Fed raising rates aggressively to keep inflation in check and the market took notice. That combination equated to some panic selling that rocked the S&P 500 down as much as 10.3% in February. By the end of the month, the S&P 500 was down "just" 3.9%.
The ability to regroup was helped in part by the good earnings news. It was also helped by a rationalization in the market's mind that rising interest rates were a good because they came as a result of an improving economy that would be good for earnings growth.
TRADE WAR
After the early onset damage, the S&P 500 eventually ruined my Veganness (damn you @SimpleTrader1) by slowly climbing to a new record high of 2940.91 on September 21. This rise ignored many concerns along the way, like the potential dissolution of NAFTA, talk of peak growth in economic activity and earnings, the inability of the UK to come up with an agreeable Brexit plan, protectionism policies pursued by the U.S. in an effort to cut trade deficits with major trading partners.
The protectionist agenda included the implementation of tariffs on imports of steel and aluminum, and more comprehensive tariff action on more than $200 billion worth of goods imported from China.
The U.S., Canada, and Mexico ultimately reached an agreement on a new NAFTA deal, known now as the United States-Mexico-Canada agreement (USMCA), which is still awaiting Congressional approval; the US and European Union ultimately agreed not to slap each other with new tariffs as talks aimed at reducing tariffs and trade barriers were ongoing. The U.S. and China ultimately agreed not to escalate tariff actions further for 90 days (ending March 1, 2019) as they try to work out a deal to correct structural trade issues.
The trade war with China has been a serious overhang all year. That said, it didn't affect the stock market much early on since the impact of the tariffs, and retaliatory tariffs, hadn't shown up to any significant degree in the data other than in imports from China, which were pulled ahead to circumvent impending tariff actions.
By year end the stock market was in fully occupancy of U.S./China trade relations. Serious concern arose that a trade agreement could not be made in the allotted time window, raising the question of the U.S. following through on a threat to raise its tariff rate on imported goods from China to 25% from 10% and to put new tariffs on even more Chinese imports.
The U.S. and China are slated to hold trade talks the week of January 7, and it's safe to say that those trade discussions, and others that may follow, will be a focal point at the start of 2019.
China Developments:
On December 1st, Trump agreed that on January 1, 2019, he will leave the tariffs on $200 billion worth of product at the 10% rate. China will agree "to purchase a not yet agreed upon, but very substantial, amount of agricultural, energy, industrial, and other product from the United States to reduce the trade imbalance between our two countries. China has agreed to start purchasing agricultural product from our farmers immediately."
Trump and President Xi agreed to immediately begin negotiations on structural changes with respect to forced technology transfer, intellectual property protection, non-tariff barriers, cyber intrusions and cyber theft, services and agriculture. Both parties agree that they will endeavor to have this transaction completed within the next 90 days (deadline March 2, 2019). If at the end of this period of time, the parties are unable to reach an agreement, the 10% tariffs will be raised to 25%.
China's statement is slightly different in language. See Bloomberg Article for additional color in English. For example, China said they would work toward scrapping all tariffs and reach a mutually beneficial agreement. The U.S. statement does not include this. Also, China has not publicized a specific 90-day time window.
Trump tweeted that China has agreed to reduce and remove tariffs on cars (to 15%) which are currently at 40%.
Several officials from both countries will meet in China for another round of talks on the week of January 7. On 12/29, Trump tweeted "Just had a long and very good call with President Xi of China. Deal is moving along very well. If made, it will be very comprehensive, covering all subjects, areas and points of dispute. Big progress being made!."
It remains unclear how the arrest of Huawei CFO Meng Wanzhou will factor into trade talks, if at all. Reuters reported that Trump is considering an executive order to ban purchases of China's Huawei and ZTE telecommunications equipment.
Several U.S. companies were asked to submit feedback regarding restrictions of high tech exports such as artificial-intelligence products. That feedback is due to the Administration on January 10. There is no timetable for a final decision by the White House.
Fed
The Fed was the prominent focus in trading matters in 2018. Not only because it elected to raise the target range for the fed funds rate four times and cut the size of its balance sheet in an effort referred to as "quantitative tightening", but also because those actions were vocally criticized by Trump as being misguided.
Trump minced no words about the Fed's actions, stating he wasn't happy with his pick of Jerome Powell to be Fed Chair. The public criticism created some nervous trading behavior in the stock market, which felt the Fed's independence was being put to the test by the Orange idiot’s remarks in a way that made it impossible for the Fed not to raise rates. That sounds contradictory, but the logic here was/is that the Fed would be “forced” to tighten to maintain their credibility and sense of autonomy.
Fed Chair Powell made it clear in December that the Fed is not swayed by political opinions and that its decision making is (and will be) data dependent. That reminder came at the same time updated projections from the Fed revealed a median estimate for two more rate hikes in 2019. These combination of factors along with a lack of Dovish tone escalated the selling in the markets. The stock market wasn't a fan of the rate-hike outlook, and investors were left to think the Fed might be on course to make a policy mistake by raising rates too much and/or too fast.
On the back of that, December added to losses that started to mount at the start of October as peak growth concerns hit home amid a steady stream of disappointing data from abroad, a flattening of the yield curve, and ugly performances by cyclical sectors here at home, and stocks in general, that were viewed as harbinger of slower growth ahead.
Those growth concerns are on full display with the compression in the P/E multiple despite the S&P 500 being on track to deliver its best year of earnings growth since 2010.
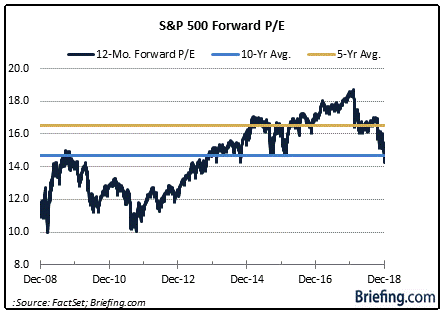
SPX PE Courtesy of Briefing.com
The forward 12-month P/E/ multiple for the S&P 500 stood at 18.3x entering 2018. Today, it stands at 14.4x.
End With A Bite:
Everything got caught up in the wash at the end of the year, including the FAANG stocks, which were all but invincible in 2017. The selling pressure on those names (Facebook, Apple, Amazon.com, Netflix, and Alphabet) became a major drag on the broader market given their collective market weight and how widely owned they are in passive and active funds alike.


Every sector was down at least 4.5% in December. Eight of 11 sectors saw double-digit percentage declines in the fourth quarter ranging from 10.3% (health care) to 24.7% (energy). The bloodshed in the energy sector was a byproduct of the bloodletting in oil prices. To note, oil prices collapsed 41% from their October 3 high on the back of concerns about excess supply and a global growth slowdown.
By the end, only the utilities sector found itself in the positive for the fourth quarter.
A year that began full of optimism, catalysts, and tailwinds about the economic and earnings outlook ended with an audible crash on the back of concerns about the economic and earnings outlook.
That has left the S&P 500 on the cusp of registering its first decline on a total return basis since 2008. Though the decline will be relatively modest in scope, it will feel a lot worse given how fast and how far the sell-off was from the all-time high hit in September.


2018 will go down as an historical anomaly. There had never been a down year for the market since 1950 when the S&P 500 has gained at least 4.0% in January until this one.
SHAMLESS PLUG AND POD
For the sake of clarity and for the sake of fun, I will be releasing a podcast soon. If you have any ideas for topics or names please message me using the contact page on my site.
If you'd like to follow my trades in real time click the "Join Now" button at the bottom of the page. For those that will and have asked, use the code 1ST on checkout for a discount on your first three months with no commitment beyond one month.
HAVE A WONDERFUL NEW YEAR’S EVE AND MAY NEXT YEAR PROVIDE US WITH MORE CONSISTENCY THAN THE LAST