Sanmina (SANM) consensus stands at EPS of $0.56 on Revenues of $1.59 bln.
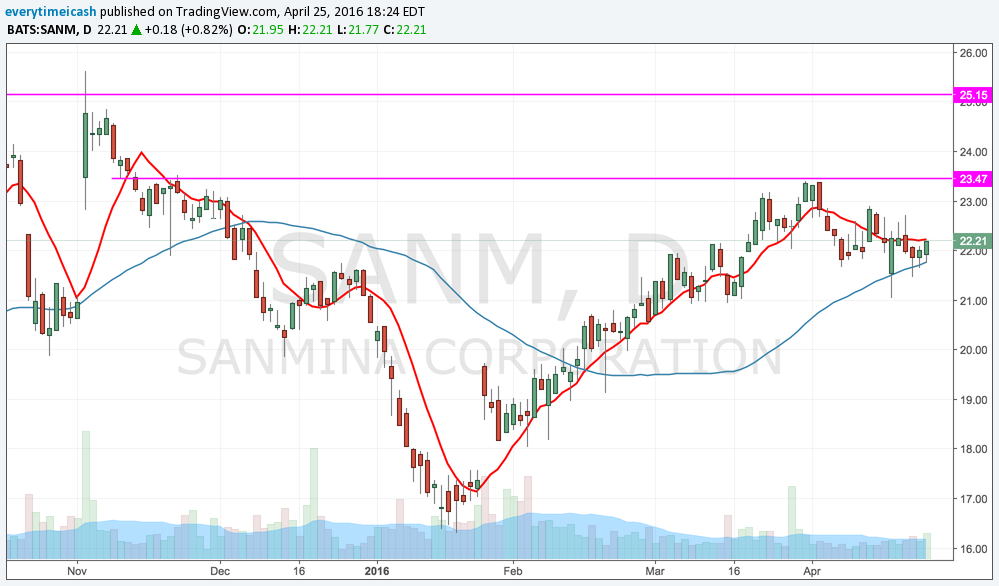
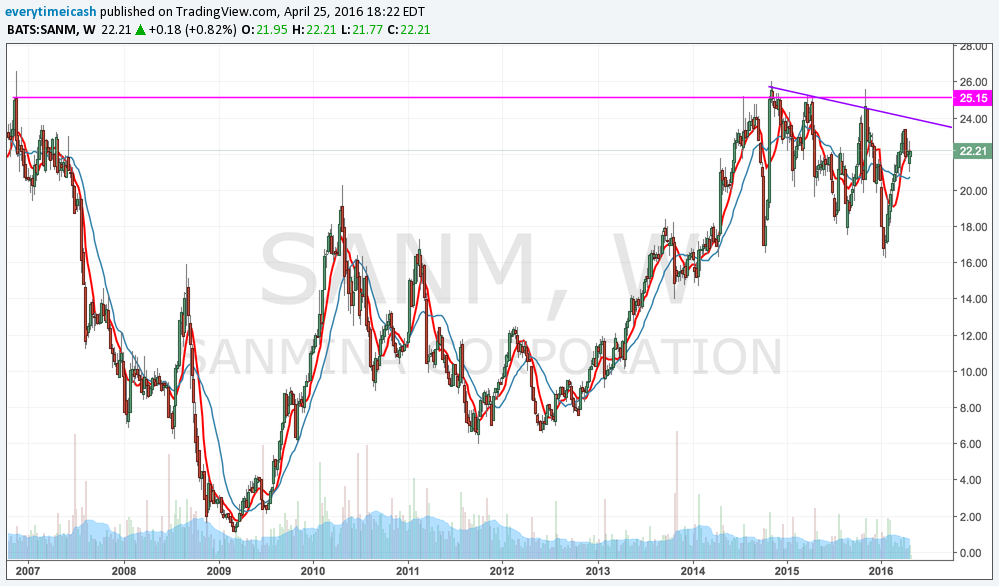
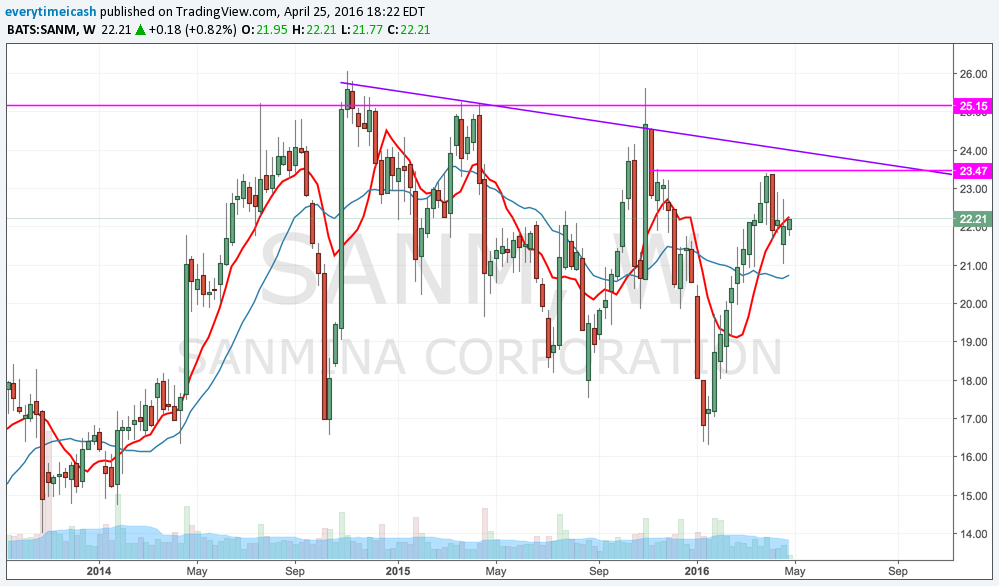
SANM is coming off a solid Q1 report. Its EPS were in line and its revenues actually missed expectations, but the revenue miss was expected. However, SANM operating margin was higher than expected and its Q2 guidance was also above consensus. The stock jumped 8% in reaction and has been a steady performer since as it would rally through a slew of key moving averages to push to $23.50.
Shares were ~30% higher from when it reported Q1 results. The stock has retraced back to its 50MA ahead of tonight's report. The decline is most likely some profit taking after a strong run during the quarter. The stock is sitting on its 50MA ($21.80) and has key support in the $21 zone.
Key Metrics
- Non-GAAP Operating Margin- Q1 came in at 4.0% which was 10 bps higher than expected. Investors would like to see this continue to rise.
- Share Repurchase- A tailwind for the Q1 results and it is expected to be a driver for Q2. SANM repurchased 1.4 mln shares for a total of $28.7 mln in Q1.
Q2 Guidance
- SANM said it expects revenue to be in the range of $1.55-1.65 bln.
- EPS is expected to be in the range of $0.55-0.59.
Q1 Recap
SANM reported Q1 (Dec) earnings of $0.58 per share, excluding non-recurring items, in-line with the Consensus of $0.58. Revenues fell 9.9% year/year to $1.53 bln vs the $1.59 bln Capital IQ Consensus.
- Ending cash and cash equivalents were $398.4 million
- Cash flow from operations was 62.7 million
- Repurchased 1.4 million common shares for $28.7 million
- Inventory turns were 6.2x Cash cycle days were 47.2 days.
- Co issued Q2 EPS guidance in the range of $0.55-0.59, excluding non-recurring items, vs. then-$0.52 Consensus Estimates. Co projected Q2 revenues in the range of $1.55-1.65 bln vs. then-$1.57 bln Capital IQ Consensus Estimate.
RESULTS
Sanmina beats by $0.07, beats on revs; guides Q3 EPS in-line, revs in-line
- Reports Q2 (Mar) earnings of $0.63 per share, excluding non-recurring items, $0.07 better than the Consensus of $0.56; revenues increased 1% year/year to $1.61 bln vs the $1.59 bln Consensus.
- Non-GAAP Operating Margin 4.10% compared to 4.00% in Q4.
- Repurchased 4.0 million common shares for $74.7 million
- Inventory turns were 6.5x
- Cash cycle days were 44.6 days
- Co issues in-line guidance for Q3, sees EPS of $0.61-0.65 vs. $0.61 Capital IQ Consensus Estimate; sees Q3 revs of $1.625-1.675 bln vs. $1.64 bln Capital IQ Consensus Estimate.


