

One of the major advantages I actually do have from some of my weirdly antisocial traits is my ability to compartmentalize and not get too attached. This kind of sucks when you’re dealing with interpersonal relationships, but when it comes to analytics it really does give me an added boost.
With that said, early in December I released a podcast that gave a real world analogy about what I felt was going on in the market. I likened the market to a bad breakup and alluded that the relationship was over. Just like any long term relationship, the relationship is almost never totally over after the first break up. More often than not, you still fuck around and see each other from time to time. Next thing you know, you’re back to behaving like it’s a relationship but one of you is just propping their emotions until the final coffin nail hits.
I find it now as good a time as ever to echo the reminder that we are not to fall in love.
Debate:
I just had a back and forth debate with @SimpleTrader1 in our Discord group about tempering expectations and I found that it would be a valuable insight to share. The conversation started with the following disagreement.
Disagreement
At first blush, it comes off as though I am a stubborn asshole with my comment to him but I do clarify it to he and the others and this was in the form of a healthy debate.
Explanation of my thoughts
In the above I express to @SimpleTrader1 and the others that this is a similar market behavior to one that I witnessed in 2007-2008. It is actually freakishly similar. During that stretch, the market Broke hard in February 2007. It was able to hold that initial break and rally from that point on to new highs. From there, it failed again and held, rallied to a new high but not an absolute high, failed and held support once again, then rallied to a lower high before breaking down in early 2008. From that breakdown, the market found support and rallied off the lows around 10-12% before chopping around and subsequently falling apart. Though there are some differences; like the one where the market rallied for most of December in 2008, the theme is very similar. Below you will see the charts indicate this.


In the above you can see the similarities between the selling and the trends that occurred in 2007-2008 and the selling and patterns that occurred just last year in the markets. From that point on, the rebuttal from him was, well, for lack of a better word, simple. He stressed that the difference this time versus 2008 is that the major trend this time is still in tact.
Major difference in technicals between 2007 and 2018
He is correct, the major trend was not broken, and that supports the argument that we may not have a more significant breakdown coming. However, as I point out to him, we were very extended above that major trend line and had not tested it in quite some time. Specifically, below you can see the two charts. Technically speaking, when we broke down in February we were at the highest RSI reading in history and from there we never recovered the highs set on an absolute basis.


Though he is correct, the trend from 2009 has not officially broken down yet, the market has also not tested that trend in the last two years. Every single major breakdown was just simply a blip when you back out and see where we are along that line. From that point on, I asked him to perform the following exercise that I will ask anyone reading this to do should they feel bullishly inclined.
Go back and look up the historical outcomes once we have had an outside reversal year to the downside. When you are done with that, take the following into consideration.
CONTEXT
The above is a prime example of what I often see on FinTwit that I try to make a point to emphasize to anyone and everyone who trades. Technicals are important, but they are just part of the picture. I rely on momentum and technicals more than most who trade but I do understand that if that is my entire process I will eventually get ramrodded. The data and fundamentals that surround the technicals are equally important and in some cases more important than the technicals themselves.
I gave @SimpleTrader1 and the others a little insight from my 2019 Preview Packet. I explained to he and the others that on average bear market scenarios play out to the tune of 39% with a mean of 34%.
Below you will find a chart thanks to BofAML:
History of Bear Markets
Specifically, since 1928, the SPX has had 13 bear markets. 10 of those markets have coincided with US recessions. The exceptions were 1961, 1966 and 1987. Those events were short lived (relatively) and were followed by furious recoveries. Typically, the stock market leads the overall economy by 1-2 quarters, and on average, the market peaks 7-8 months before a recession (typically). It is important however to remember that these are averages. In 1948 for example, the market peaked 2.5 years before the official start of a recession.
Secondarily, the fundamental issue to pay attention to in this market is that the pace of the growth has been unequivocally weak. The pace of the recovery has been particularly weak with annual GDP growth averaging ~2.3%. The Debt to GDP is now at 60%
Real GDP growth ahs only averaged 2.3% for the current expansion compared with 2.9% with the last one and 3.6% for the one that occurred in 1991-2001. Bear in mind, the GDP growth during this expansion cycle has come on the back of zero interest rates. So that raises the question, where is the growth going to come from now that the Fed is in a QT process with interest rates "normalizing”.
The other important distinctions to account for are that we just had potentially cycle highs on earnings. Specifically, according to FactSet, the 10.5% increase in second quarter revs was the highest growth since Q3 2011; the 26.0% EPS growth in the third quarter was the highest since Q3 2010; and the 20.3% earnings growth projected for calendar 2018 would be the highest for the S&P 500 since calendar year 2010. Even with that staggering growth, which was aided by a corporate tax benefit that was not expected, the markets found that the Fed’s actions were unsustainable for further asset growth. We are in earnings season so we will get insight on the earnings front starting next week when the big banks kick off earnings season.
The last points to account for are the global nature of the markets today. Specifically, it will be increasingly difficult to expand to new highs should global growth slow down any more than it has already. Secondarily, the tariff situation unresolved will create even more uncertainty and issues. Those two situations can hamper any real upside the market has beyond the wood we are chopping through now. The wild card here will be the orange dude in the white house who is unstable.
NAIL AND BAIL:
This conversation started off as a debate so I want to share how it finished.
By the above tone I’m sure some of you thought that I was some pissed off permabear. That couldn’t be farther from the truth. In fact, as the above exchange shows you that I emphasized to him that his bullish thesis is not a problem, I just emphasize caution and skepticism in that thesis.
“Nail and bail.”
TECHNICALS:
The entire above conversation leads us to this; what are we looking for moving forward? Well, with earnings on deck there is a potential that we can fail here as the rally has gone “too far too fast”. The NYMO reading currently is the highest it’s been since 2009. In 2009 it was at 122 as of today it’s at 113. In 2009, after that reading, the market imploded 14% in just nine days.
That said, there is also a potential that the pain to the upside continues as there is still room to the upside before the downtrend is resumed. So with that, if we do not fail at or near these levels lets point out some stocks to watch for further upside.
Simultaneously, many of these stocks are at major resistance points and should they fail use the resistance as a level to bet against.
The most interesting part of all of this is that we have rallied incredibly since Christmas Eve and there has absolutely no talk of “algos driving the markets” or computers or anything like we heard on the way down.
That said, let’s highlight the overall indices again to see where we stand.


As we can see, we still have a little upside room to go should that indeed be the path with IWM having the least room left.


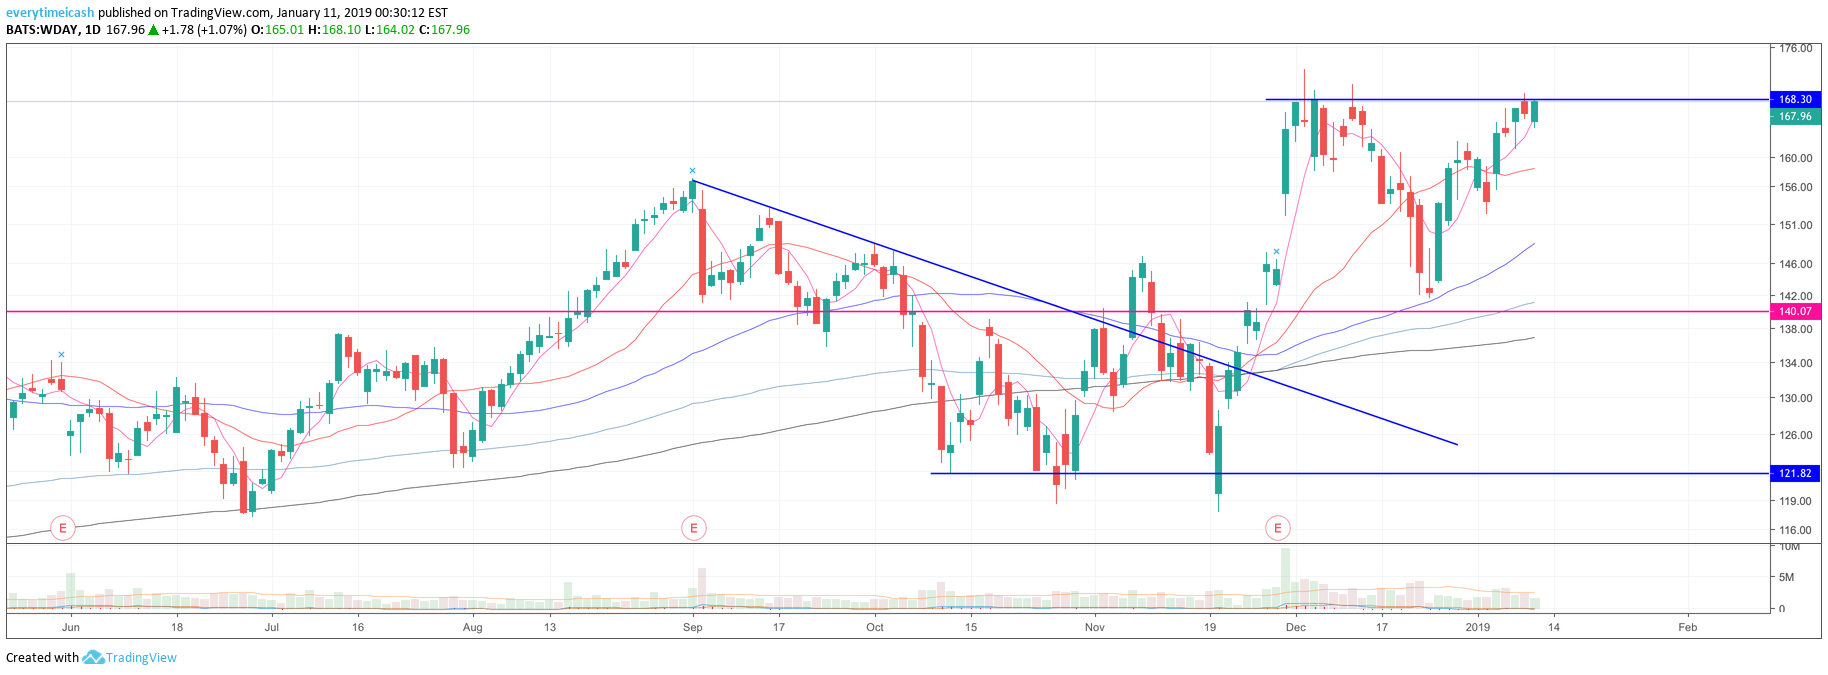


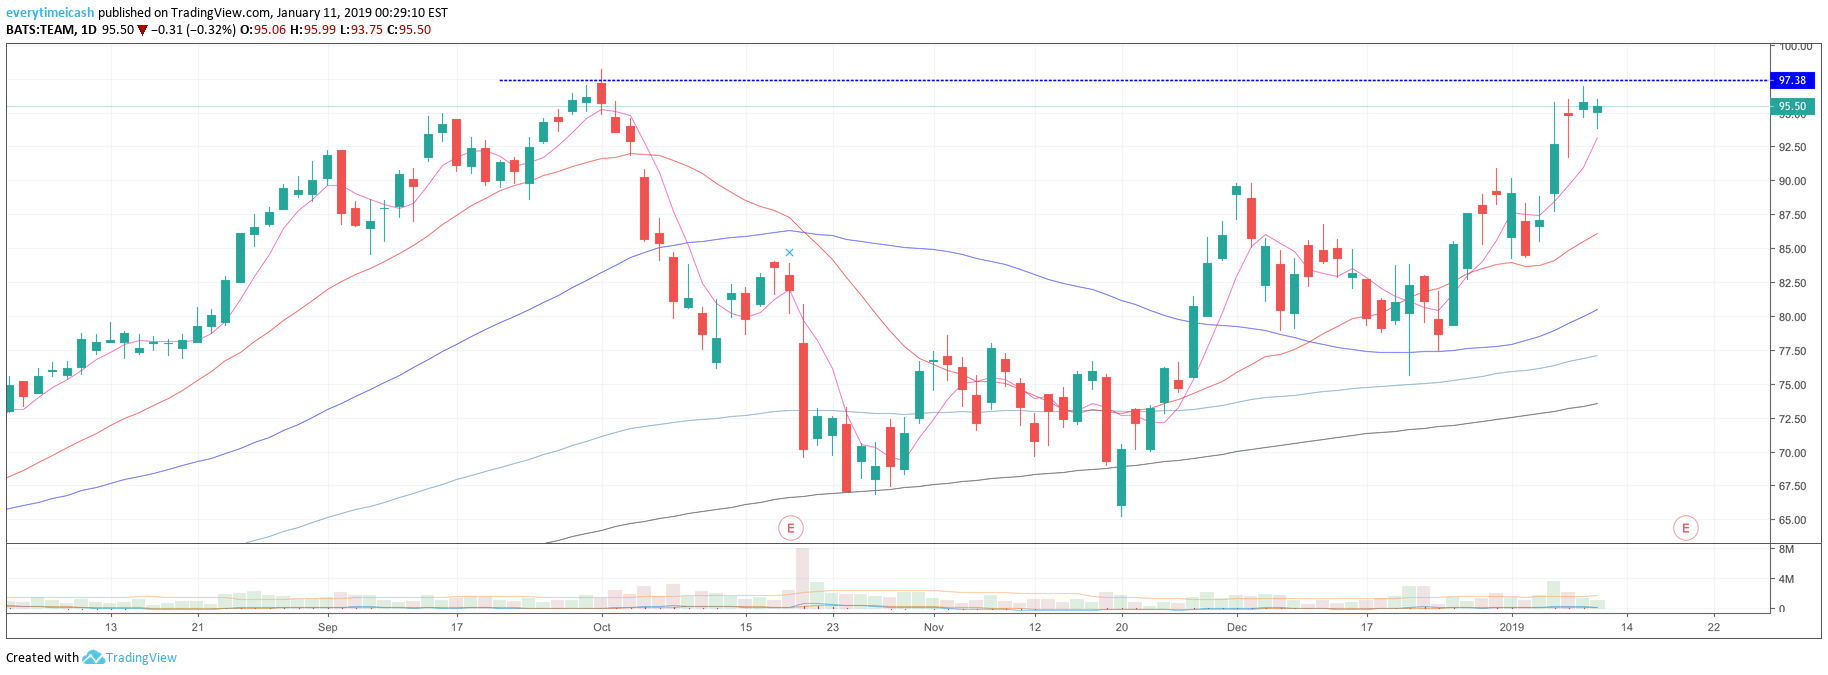


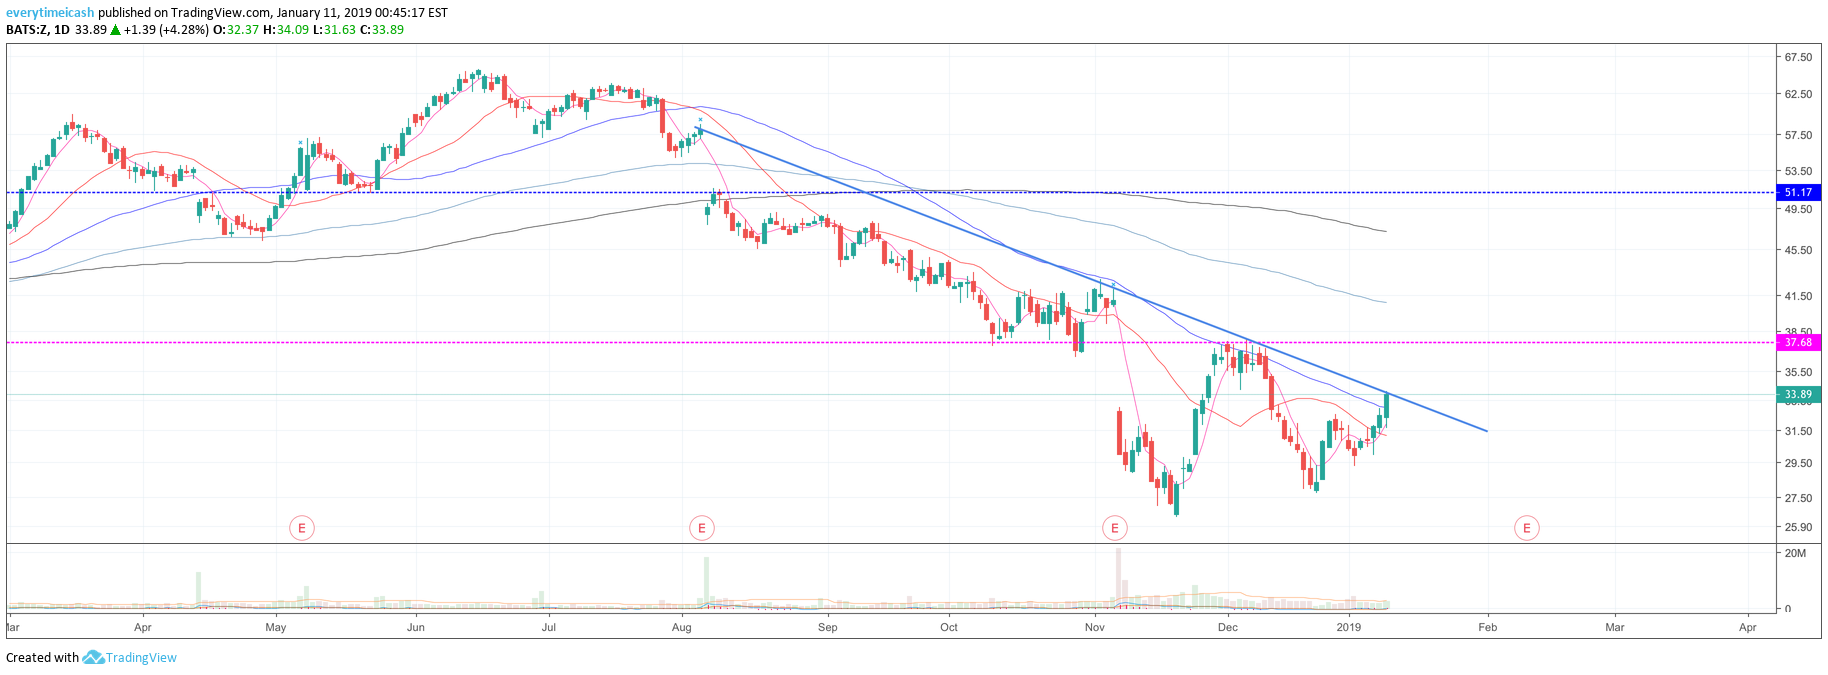


As you can see from above, there are a lot of setups to trade from/against. @SimpleTrader1 could be correct in his belief for higher at this time but this will rely on earnings and on the overall indices not failing here.
💔💔💔Be nimble. Don’t fall in love.💔💔💔
SHAMLESS PLUG AND POD
For the sake of clarity and for the sake of fun, you can check out my podcast above by clicking the Soundcloud block. You can also click here. If you have any ideas for topics or names please message me using the contact page on my site.
If you'd like to follow my trades in real time click the "Join Now" button at the bottom of the page. For those that will and have asked, and in honor of @SimpleTrader1, use the code 1ST on checkout for a discount on your first three months with no commitment beyond one month.