Viewing entries tagged
$LNKD

Like Me ($FB)

Like Me ($FB)

Facebook (FB) is set to report Q2 results tonight after the close with a conference call to follow at 5pm ET. 

Current Capital IQ consensus stands at EPS of $0.82 on Revenue of $6.00 bln.

  • Revenue Growth- Q1 revenue growth was 51.8%; Q4 saw revenue accelerate to 52% compared to 40% in Q3 and 39% in Q2.
  • Advertising Revenue- Q1 increased 57% y/y to $5.2 bln; Q4 came in at $5.637 bln which was also up 57% y/y.
    • Mobile Advertising Revenue- Mobile advertising revenue represented approximately 82% of revenue in Q1 compared to 80% in Q4. This is expected to see a small uptick.

Q1 Recap

  • FB reported Q1 (Mar) earnings of $0.77 per share, $0.15 better than the Capital IQ Consensus of $0.62; revenues rose 51.8% year/year to $5.38 bln vs the $5.26 bln Capital IQ Consensus.
    • See key metrics above.
  • FB also announced its proposal of a new class of stock so look for some updates on this on the call.
  • Why it's important
    • Ad spending drives Facebook's top line, accounting for 97% of the company's revenue in the first quarter.  Facebook, therefore, is watched closely as a barometer for how advertisers are spending and where they are allocating their advertising budgets.
    • Facebook is a leadership stock for the Nasdaq and Nasdaq 100
    • The company and its stock serve as guides for the enthusiasm surrounding the growth of social media
       
  • What Facebook said after its first quarter earnings report in April
    • Daily active users (DAUs) were 1.09 billion on average for March 2016 (+16% year-over-year); mobile DAUs were 989 million on average for March 2016 (+24% year-over-year)
    • Monthly active users (MAUs) were 1.65 billion as of March 31, 2016 (+15% year-over-year); mobile MAUs were 1.51 billion (+21% year-over-year)
    • The average price per ad increased 5% in the first quarter while total ad impressions increased 50% (strong growth in mobile ad impressions)
    • Will face tougher comparisons in 2016 given the acceleration of ad growth in 2015
    • Guidance
      • Non-GAAP expense growth of ~45-55% year-over-year
      • Amortization will be $700 million to $800 million
      • Stock-based compensation to be $1.1 billion to $1.3 billion in 2016
      • Sees capex at the high end of $4.0 billion to $4.5 billion range previously provided
      • Second quarter and FY16 tax rates should be similar to first quarter
         
  • Other Stocks to Watch
     
    • FB
    • Alphabet (GOOG/GOOGL)
    • LinkedIn (LNKD)
    • Yelp (YELP)
    • PowerShares QQQ Trust (QQQ)
    • Global X Social Media Index ETF (SOCL)
      • FB is third largest holding at 9.37% of assets
    • S&P futures

Click here to listen to my podcast and learn about my theory on the similarities between relationships and the stock market.
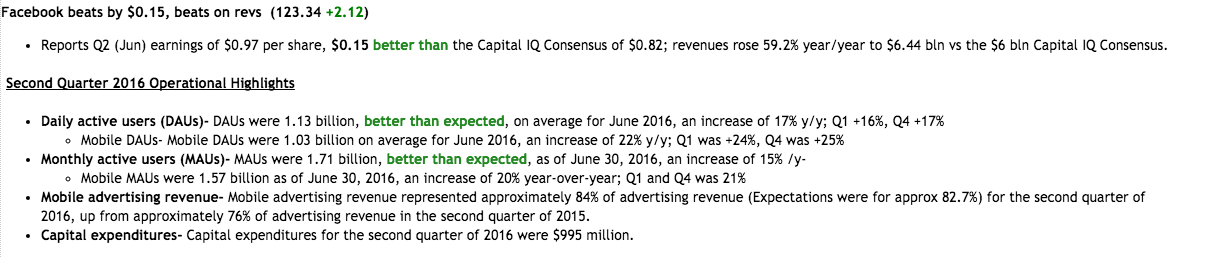

RESULTS:


Jack Be Nimble ($TWTR Earnings Preview)

Jack Be Nimble ($TWTR Earnings Preview)

Twitter (TWTR) is set to report Q2 earnings tonight after the close with a conference call to follow at 5pm ET. Current Capital IQ consensus stands at EPS of $0.09 on Revenues of $607.4 mln.

Late For Work ($LNKD Earnings Preview)

Late For Work ($LNKD Earnings Preview)

'Yeah, so the online business, it has been decelerating over the last few years. It's a structural decel, if you look at our Subs business in the aggregate... the trajectory of the online business is it's been pretty linear in terms of the year-on-year growth rate.'

Like Me ($FB Earnings Preview)

Like Me ($FB Earnings Preview)

Unlike many other companies, expectations for Facebook remain quite high.  Failure to meet those expectations could cause a material decline in its stock, which is up 31% over the last 52 weeks.

Ad spending drives Facebook's top line, accounting for 95% of the company's revenue in 2015. FB is a barometer for how advertisers are spending and where they are allocating their advertising budgets.

Facebook has a large international presence with 86% of its 1.59 billion monthly active users at the end of 2015 residing outside the U.S. and Canada and 50% of its total 2015 revenue derived outside the U.S. and Canada. Facebook, then, will have some revealing insight to share on global economic activity and the impact of foreign currency on its operating results. 

Facebook is a leadership stock for the Nasdaq and Nasdaq 100. The company and its stock serve as guides for the enthusiasm surrounding the growth of social media

  • Facebook had 1.59 billion monthly active users as of December 31.  Any company with that many users/customers warrants a closer look when it reports earnings.
     

FB 4th Quarter: 

  • Daily active users (DAUs) were 1.04 billion on average (+17% year-over-year); mobile DAUs were 934 million on average (+25% year-over-year)
  • Monthly active users (MAUs) were 1.59 billion (+14% year-over-year); mobile MAUs were 1.44 billion (+21% year-over-year)
  • The average price per ad was up 21% while total ad impressions increased 29% year-over-year; that was the first quarter since Q3 2013 that total ad impressions increased on a year-over-year basis
  • Faces tougher comparisons given the strong 2015 performance
  • 2016 will be another significant investment year for Facebook
  • Guidance
    • Non-GAAP expense growth of ~45-55% year-over-year
    • Sees capex in the range of $4.0 billion to $4.5 billion
    • Expects to see FX headwinds, particularly in the first half of the year due to tougher comparisons
       

Tough to be short this stock into earnings, especially at this point.

Affected Stocks:

  • FB
  • Alphabet (GOOG/GOOGL)
  • Twitter (TWTR)
  • LinkedIn (LNKD)
  • Yelp (YELP)
  • PowerShares QQQ Trust (QQQ)
  • Global X Social Media Index ETF (SOCL)
    • FB is largest holding at 12.3% of assets


RESULTS:

Facebook beats by $0.15, beats on revs  

  • Reports Q1 (Mar) earnings of $0.77 per share, $0.15 better than the Capital IQ Consensus of $0.62; revenues rose 51.8% year/year to $5.38 bln vs the $5.26 bln Capital IQ Consensus.
    • Advertising revenue increased 57% y/y to $5.2 bln.
  • Daily active users (DAUs)- DAUs were 1.09 billion on average for March 2016, an increase of 16% year-over-year.
    • Mobile DAUs- Mobile DAUs were 989 million on average for March 2016, an increase of 24% year-over-year.
  • Monthly active users (MAUs- MAUs were 1.65 billion as of March 31, 2016, an increase of 15% year-over-year.

    • Mobile MAUs- Mobile MAUs were 1.51 billion as of March 31, 2016, an increase of 21% year-over-year.

  • Mobile advertising revenue- Mobile advertising revenue represented approximately 82% of advertising revenue for the first quarter of 2016, up from 73% of advertising revenue in the first quarter of 2015.
  • Capital expenditures- Capital expenditures for the first quarter of 2016 were $1.13 billion.
  • Free cash flow for the first quarter of 2016 was $1.85 billion.

🔥🔥MONSTER QUARTER, AGAIN. THEY'RE KILLING THEIR "COMPETITION"🔥🔥


Facebook announces proposal of new class of stock

FB announced that the board of directors has approved a proposal to amend and restate existing certificate of incorporation to create a new class of non-voting capital stock, known as the Class C capital stock.

If approved, it will issue two shares of Class C capital stock as a one-time stock dividend in respect of each outstanding share of our Class A and Class B common stock. This proposal is designed to create a capital structure that will encourage Mr. Zuckerberg to remain in an active leadership role at Facebook. 

The adoption of the proposal is subject to the approval of our stockholders at our 2016 Annual Meeting of Stockholders to be held on June 20, 2016.
— FACEBOOK

Facebook Conference Call Highlights

  • Apps continue to show momentum.
  • Mobile continues to drive growth.
  • Mobile ads being driven by supply and demand; demand- investments to improve solutions

Q1 Avg Price per ad increased 5%; total ad impressions increased 50%; strong growth in mobile ad impressions.

  • Will face tougher comps in 2016 given acceleration of ad growth in 2015
  • Payment fees revenue will also see headwind even with Oculus; expects y/y decline.
  • Expense Outlook remains unchanged at Non-GAAP growth of 45-55%; Amortization will be $700-800 mln; SBC $1.1-1.3 bln in 2016; CapEx will be at the high end of $4.0-4.5 bln range previously given; Q2 and FY16 tax rates should be similar to Q1. 

FB breaks through all time high on stellar report, again. 

$FB prints 119.44 ALL TIME HIGH after hours.