
“It is not good to be too curious about all the reasons behind price movements. ”
Like many, I spent a part of my weekend keeping tabs on what was going on in Paris. I tried my best to avoid 3rd part media outlets and tried to stick to raw data from a Reddit thread a friend of mine passed on to me. Going into Friday my bias was to the downside and with relentless selling pressure and support broken on Friday in SPX I saw no reason for that downside pressure to cease.
So with the news of a terror attack shortly after the market closed on Friday it was no surprise that stock futures accelerated their declines. And when they closed for the remainder of the weekend at 8pm on Friday, the markets were hinged on just how bad the news would be from Paris. Two days of pins and needles. When they finally reopened Sunday night those wanted to panic did. And with that sudden and slight panic we tested the 2000 support level on SPX and found support there. Monday's session followed this lead and the markets continued in uptrend fashion "business as usual."
Personally, I am not a fan of trying to find trades that require precise entries. I prefer broader time frame breakouts/breakdowns and find painting with a broader brush to provide the optimal risk reward for success. Monday's tape however provided great opportunity for "bottom fishing." Specifically with AMZN.
AMZN's stock just came off nearly a 10% decline from its all time high just this past Thursday. The issue was trading off nearly 53 points in just 1.5 sessions. This decline landed the stock near some critical support and gave us an entry opportunity. Again, I am typically the type of trader that finds broad based breakouts and breakdowns on multiple time frames, but could not resist an opportunity like this. I want to quickly assess the psychology of the trade and give a frame of reference to it for future potential finds like it.
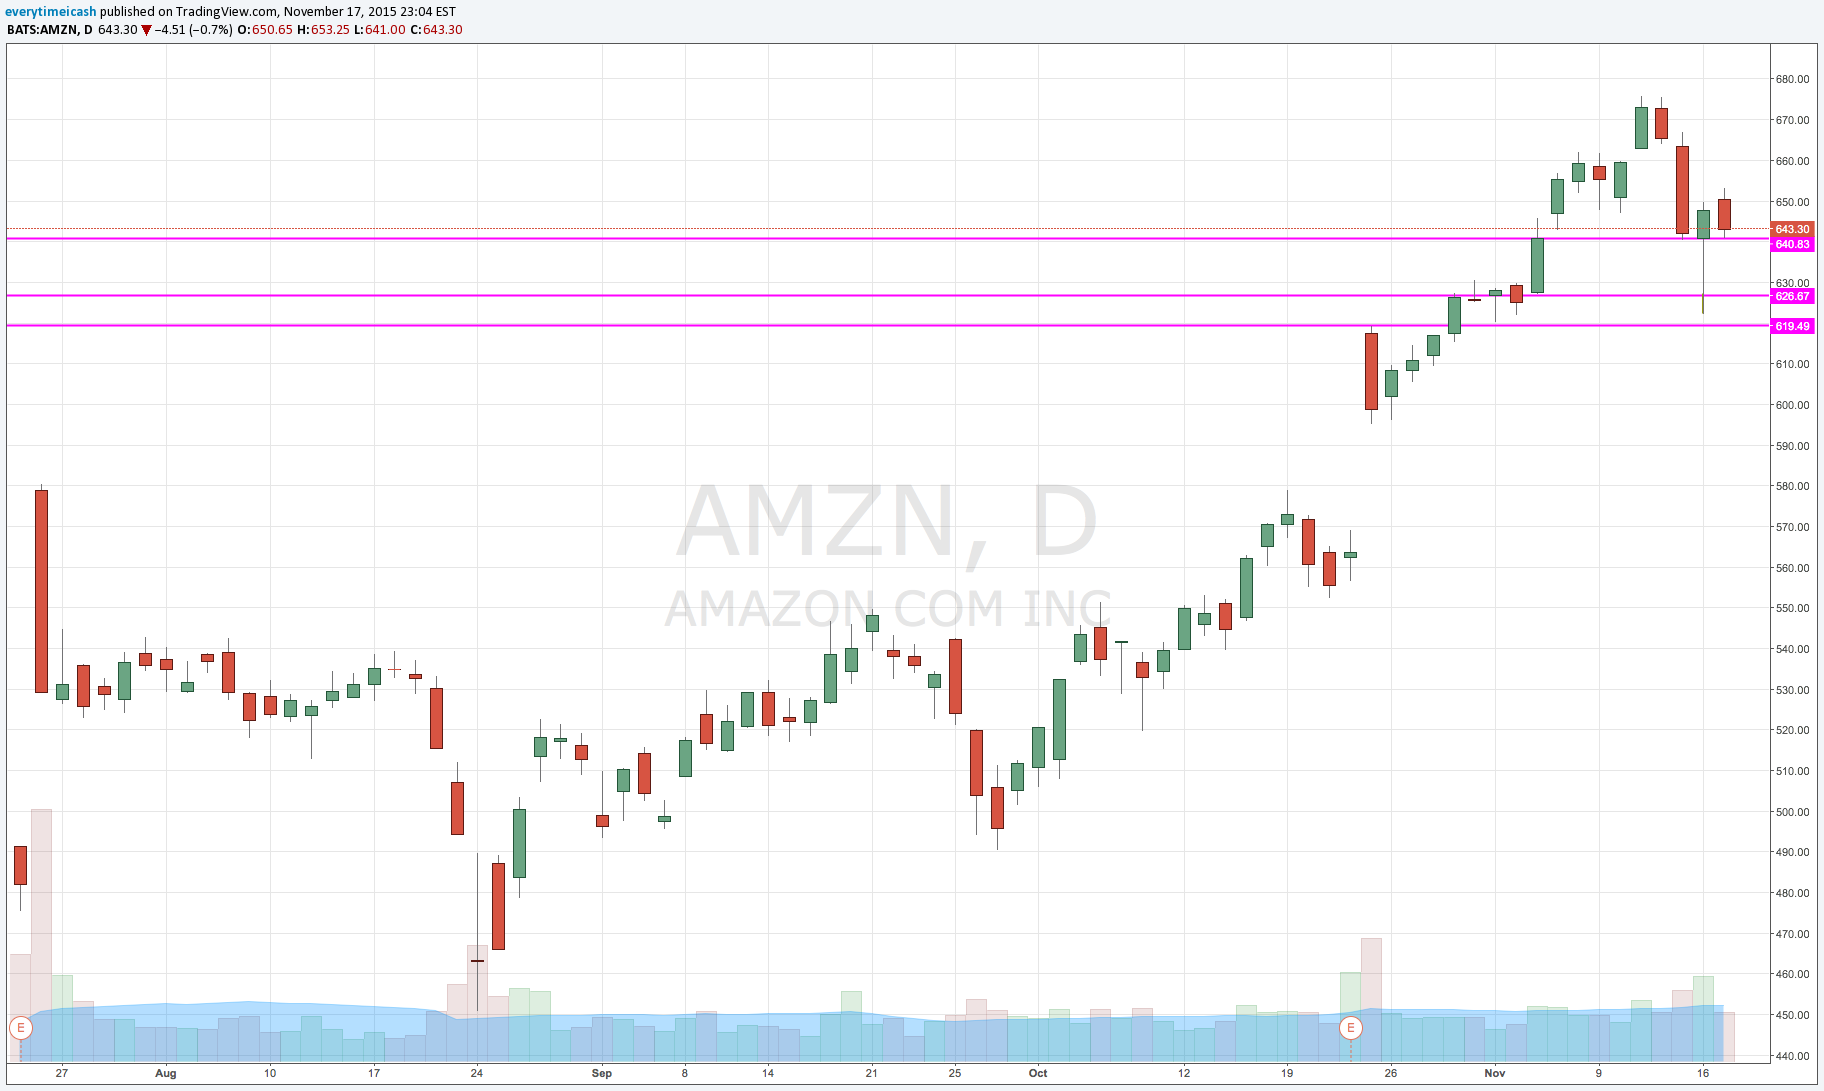
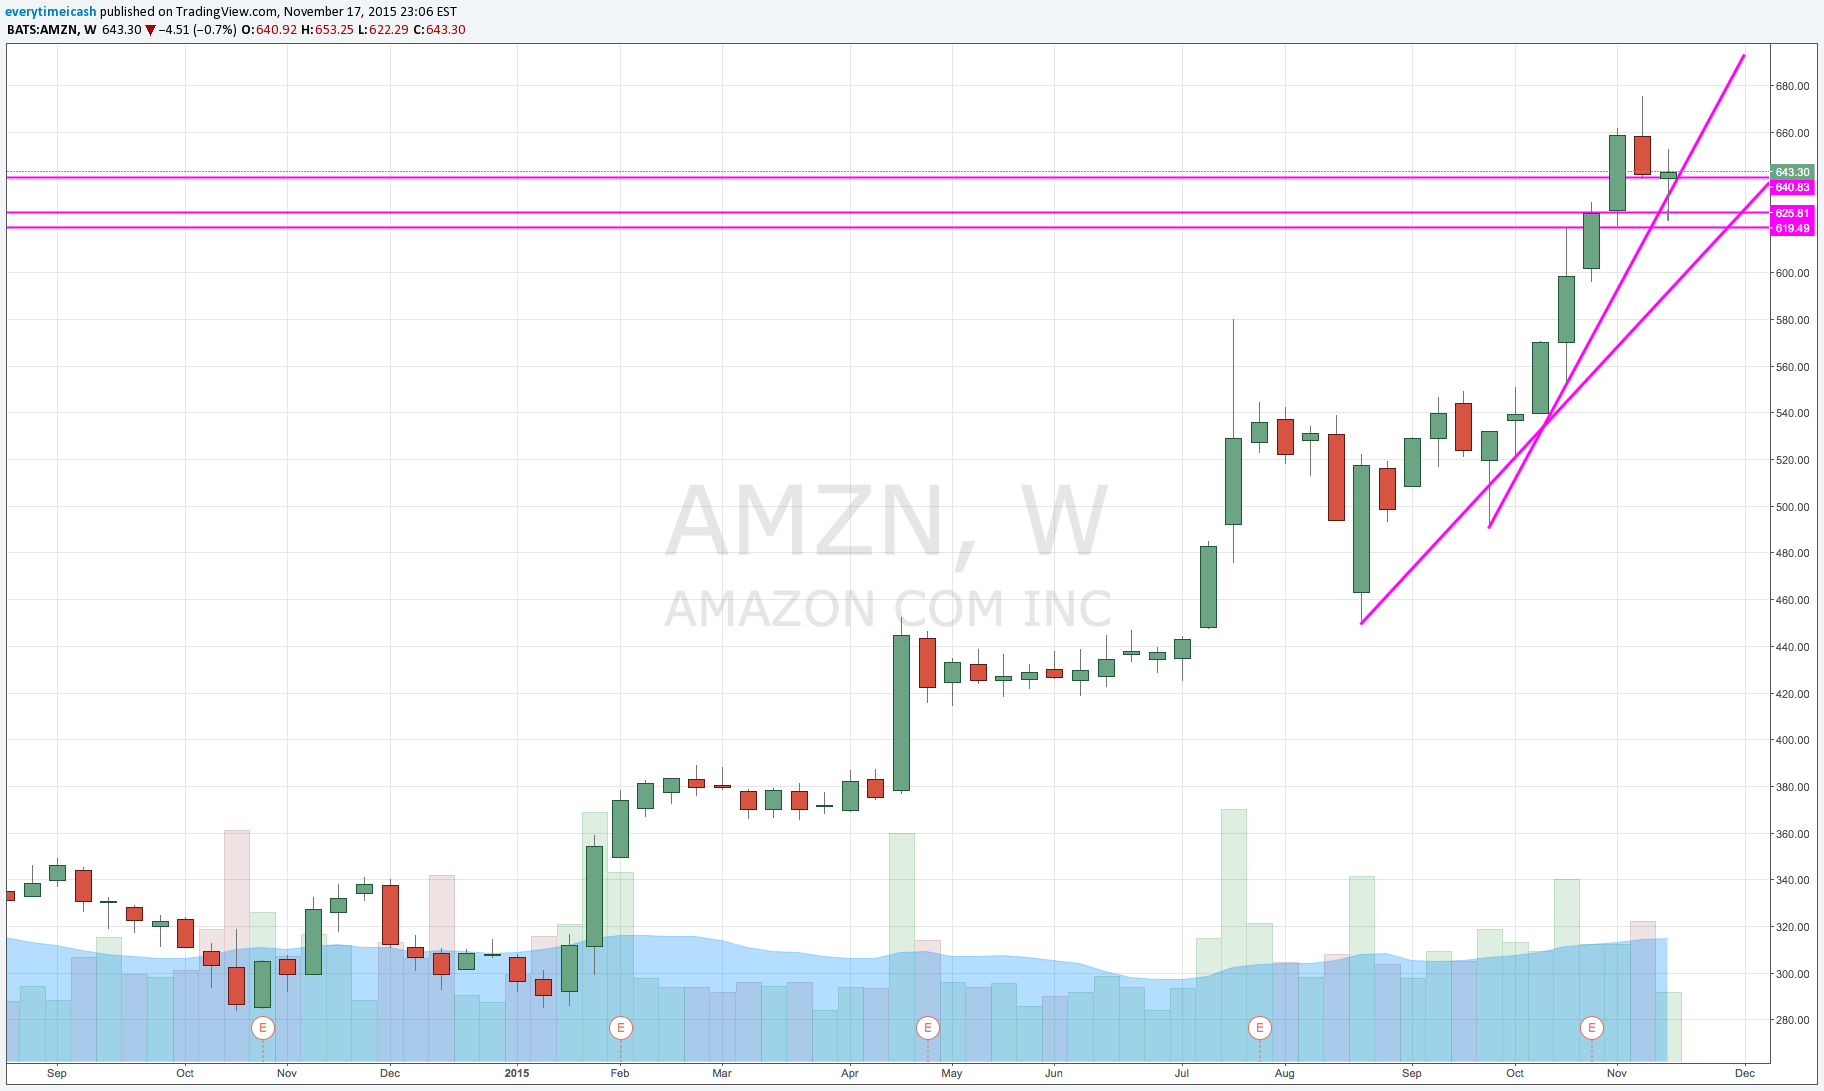

If we take a look at both the daily and weekly charts for AMZN we notice that there is support near the 620 level on the issue. Furthermore, if we take a look at the 4 hour chart we see a solid trend line in tact and both support and 50 day support lined up again near 620. With this information, I assessed how the stock would behave on a five minute basis (MOMO) intraday chart.

As we can clearly see on the five minute chart, the issue found its support around 620 as we'd hoped. Specifically we saw three hammers on the five minute followed by higher lows and higher highs. Though our exact target of 620 was not necessarily tagged, that level was in fact tested and did in fact hold. That presented us with a beautiful combination of an opportunity.
The following combination is what I'd like to highlight:
-Approximate 10% retrace from ATH in just two sessions
-Wildly "oversold" conditions both in the market itself and in the issue
-Multiple time frame support alignment
-Multiple hammers against multiple support levels.
With that said, each one of these indicators alone would present for a good opportunity to the long side. Combined they presented a great combination for a very well defined trade. Moving forward, we are now able to see what sort of potential a trade like this may have.