Viewing entries tagged
Momentum

Rise and Fall of the Gurus

Rise and Fall of the Gurus

A prudent speculator never argues with the tape. Markets are never wrong, opinions often are.
— Jesse Livermore

This will be part one of a two part write up.

I made a comment during the midst of all this recent market "madness" that if your favorite "Market Guru"/"Trader" was something like a personal trainer 15 months ago, you should probably reevaluate who you are following. Though, in part, I did it for the joke the underlying theme remains.

As the cliche goes, "a rising tide lifts all boats." For the last 16 months we've all been "privileged" to see all sorts of rafts get lifted. Between the stock market and crypto nerds everyone everywhere has become an "overnight success" and more importantly a "guru." 

I want to start this post by emphasizing that I in no way shape or form consider myself a "guru." In fact, I abhor the term. I find it to be lazy, self-congratulatory, and most importantly just plain ignorant. During my 13 year trading career, I've found the most effective way to trade any market condition is to approach trading with a "risk management" point of view. If you know what you are willing to lose before you enter a trade along with the most you're willing to lose in a day/week/month/quarter/year, you can survive in this game. Secondarily, I want to stress, it's okay to be wrong. It's also okay to not know what's going on. The sidelines are your friend and cash is in fact a position. If you are able to avoid large drawdowns (for the most part) you will survive. 


Alpha Break


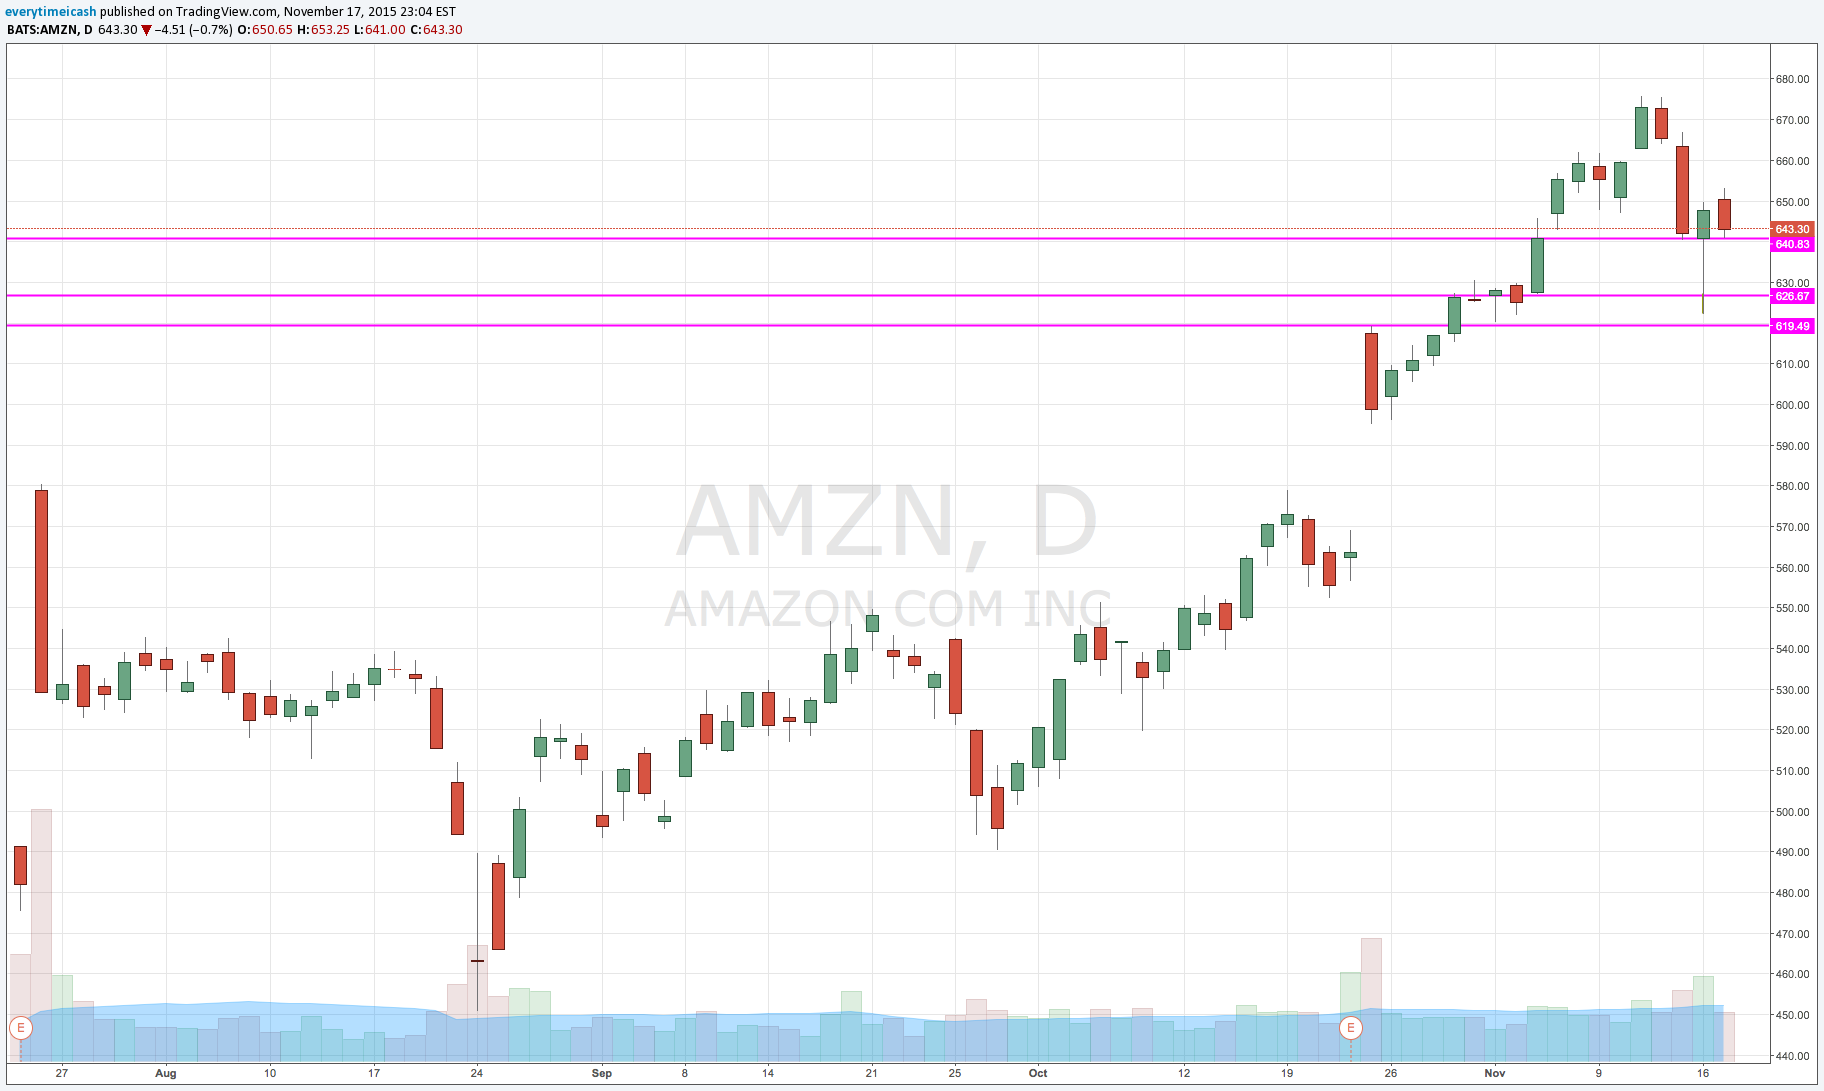
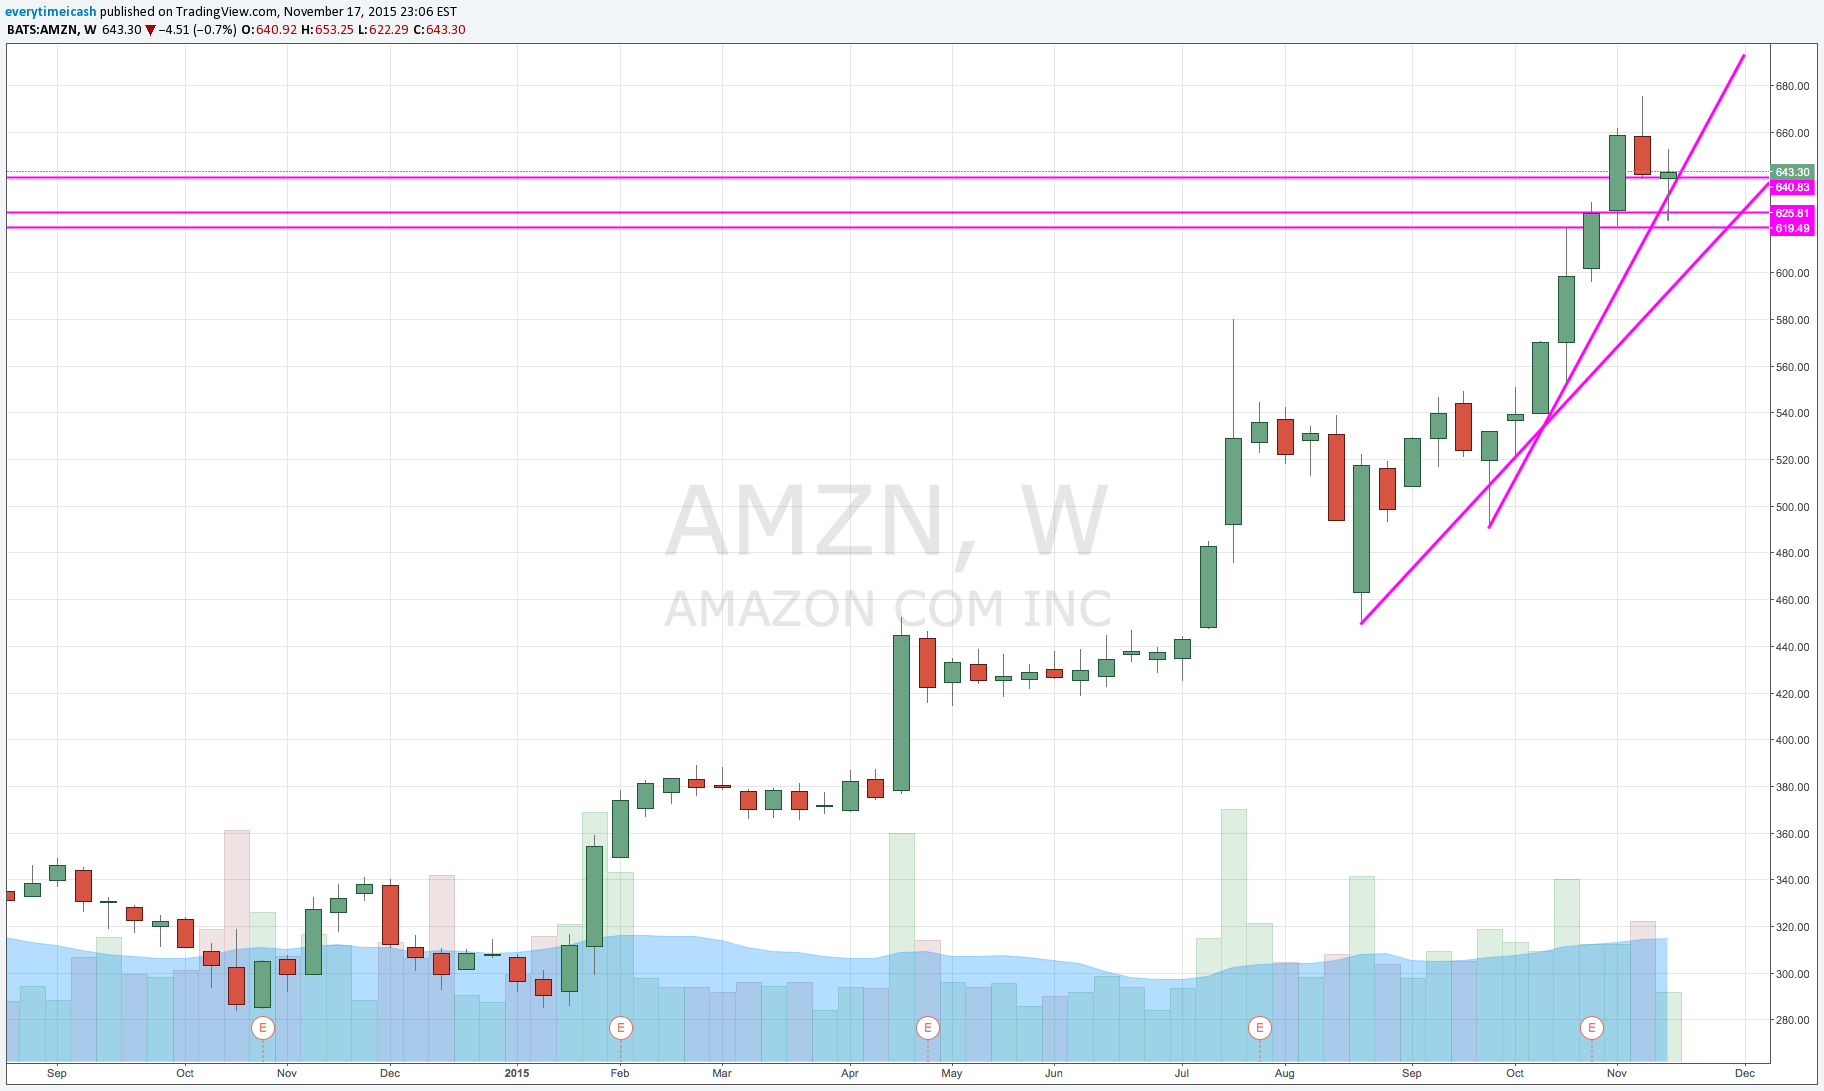
During the last 16 months traders, investors, and pretenders alike have been rewarded handsomely for buying nearly any dip in nearly any asset class. The recent narrative will tell you that investors have been making a killing by selling the VXX/VIX and puts while buying dips in assets. This compression has suppressed volatility and has kept the steady stair step higher going. During that same time, a resurgence of "Andy Zaky's" has emerged. Dudes that were once driving for Uber, working as personal trainers, school teachers, and even police officers were minted into "experts" over night.

If you are not familiar, Andy Zaky is a "former AAPL wonder-kid" with no formal training of any kind. The quick back story goes something like this; Zaky was an AAPL fan boy during it's original meteoric rise who started writing about the issue who lost nearly $10,000,000 for investors around 2012. 

Zaky grew his notoriety as he AAPL's stock rose early on. As he ramped up his price targets his "genius" inflated along with the stock price. However, like most "gurus", as the stock eventually waned and broke trend, so did his genius. Sadly, he cost investors millions as he pumped more and more money into more and more calls that subsequently ended up worthless. 

That's usually how it goes for most people, and specifically, most "gurus". As markets are in bull mode, 70% of all stocks are tied directly to the overall index. When individuals are able to identify the leaders in this bull market scenario, they are able to enhance their reputation simply by consistently announcing "BTFD" at any major support trend. As the rally continues, they are made to look like superstars. 

Unfortunately for them however, this sheepish behavior destroys winnings significantly faster as markets start to turn. As evidenced by this week, more often than not, the decays happen suddenly and without warning. "Traders" that have been conditioned to buy dips get buried quickly as support levels crumble while large institutional investors look to lock in their profits. These "traders" they find themselves struggling to get a grip of the madness that is about to bestow upon them. 

We saw this dynamic play out during the last year. Dips were swallowed by dip buyers as the VIX was choked down. Every dip was bought and every Tom, Dick, and Harry was a newly found "expert" in trend analysis and stock trading. This phenomenon was on display in full effect during the Bitcoin mania. Every other idiot I encountered was quitting their day job to "trade cryptos" while they told me how THIS is going to be how they make a fortune. Fewer than 10% of them however (yes I fact checked my sample) even knew a damn thing about the crypto market (outside of the term bitcoin) before things already went into parabolic mode. 

As reality came crashing back down, so did those profits. Every "boy genius" that was telling you "Bitcoin to $13000!" on the way up was getting awfully quiet, or worse, louder. Now they're coming to terms that they can't pay their bills in cryptos and the catch 22 that we were telling them about as things were going up is still very real:

"You're making claims that this new 'currency' will replace the currency you need to actually use in reality. You need to cash out to be able to realize your gains. You also need cash to drive the price of cryptos higher." 

Unfortunately for most who got into the game late, they're f'd. Cryptos are hanging by a thread and in a downtrend. This is still without the downward momentum kicking in. 

I dont bring this up to bash anyone who loves cryptos. In fact I think their utility will in fact change the world. I only bring this up to draw on a more important point. 

EXPERTS IN UP MARKETS ARE BULLSHIT. 

If we use the Bitcoin phenomenon as a primary example, everyone, and I mean everyone, was making boatloads of cash on the way up. Everyone was telling you how great they were at picking "the next hot crypto" and everyone was reminding you that "This is the new paradigm that will change your life." The sad reality however, it's very easy to look very smart in a bull market. It's incredibly hard to do it in a bearish one. 


De Ja Vu


The above This isn't the first example of this that I've seen. When I first started trading in the early 2000's I saw this same phenomenon with the housing market. I went to Uni in Florida and saw first hand how insane it really was. I remember trying to be "the guy that warned others" about the soon to come downfall and being hated. The sobering reality came quick and unlike when you're right about a stock, being right didn't feel good. I noticed that the same pundits that were on CNBC telling people "It will be okay!" were still manning their posts. They were able to be a talking head, be fraudulently wrong, and still be the "voice of reason" after the fact. (see video below) HOW THE FUCK IS THAT POSSIBLE?

So is the above an anomaly?

I wanted to dive a little deeper into the "guru" phenomenon and see if the Zaky thing was an "isolated event" or in fact if it's just an aggregate extreme of a larger issue. After a couple of searches I was able to find that More often than not, gurus are incorrect. Specifically, on average, the cumulative accuracy across all forecasts sits at ~47%. While thats bad in and of itself, the accuracy distribution points to even more crappy predictions. (Source: https://www.cxoadvisory.com/gurus/)

Looking at the above information, it only confirms what most people believe in the first place. "Gurus" aren't better at their job than you can be. Hell, most of them don't even bat 50%. 


TAKEAWAYS


The important takeaway from all this is not to trust any one man or woman for results. Trust the homework. Secondarily, and more importantly, knowing your risk appetite is really the only way to ensure you can survive in any market condition. There are times when you should be aggressive, there are times when you should be very aggressive, and then there are times when you should be neutral. Don't be afraid to say you are wrong early and wait for conditions to work themselves out before getting back in. 

Congrats on making it through a very volatile Q1!

Threading the Needle

Comment

Threading the Needle

It is not good to be too curious about all the reasons behind price movements.
— Jesse Livermore

Like many, I spent a part of my weekend keeping tabs on what was going on in Paris. I tried my best to avoid 3rd part media outlets and tried to stick to raw data from a Reddit thread a friend of mine passed on to me. Going into Friday my bias was to the downside and with relentless selling pressure and support broken on Friday in SPX I saw no reason for that downside pressure to cease. 

So with the news of a terror attack shortly after the market closed on Friday it was no surprise that stock futures accelerated their declines. And when they closed for the remainder of the weekend at 8pm on Friday, the markets were hinged on just how bad the news would be from Paris. Two days of pins and needles. When they finally reopened Sunday night those wanted to panic did. And with that sudden and slight panic we tested the 2000 support level on SPX and found support there. Monday's session followed this lead and the markets continued in uptrend fashion "business as usual." 

Personally, I am not a fan of trying to find trades that require precise entries. I prefer broader time frame breakouts/breakdowns and find painting with a broader brush to provide the optimal risk reward for success. Monday's tape however provided great opportunity for "bottom fishing." Specifically with AMZN. 

AMZN's stock just came off nearly a 10% decline from its all time high just this past Thursday. The issue was trading off nearly 53 points in just 1.5 sessions. This decline landed the stock near some critical support and gave us an entry opportunity. Again, I am typically the type of trader that finds broad based breakouts and breakdowns on multiple time frames, but could not resist an opportunity like this. I want to quickly assess the psychology of the trade and give a frame of reference to it for future potential finds like it. 

AMZN 4 H.png

If we take a look at both the daily and weekly charts for AMZN we notice that there is support near the 620 level on the issue. Furthermore, if we take a look at the 4 hour chart we see a solid trend line in tact and both support and 50 day support lined up again near 620. With this information, I assessed how the stock would behave on a five minute basis (MOMO) intraday chart. 

AMZN 5 Min.png

As we can clearly see on the five minute chart, the issue found its support around 620 as we'd hoped. Specifically we saw three hammers on the five minute followed by higher lows and higher highs. Though our exact target of 620 was not necessarily tagged, that level was in fact tested and did in fact hold. That presented us with a beautiful combination of an opportunity. 

The following combination is what I'd like to highlight:

-Approximate 10% retrace from ATH in just two sessions 

-Wildly "oversold" conditions both in the market itself and in the issue

-Multiple time frame support alignment

-Multiple hammers against multiple support levels. 

With that said, each one of these indicators alone would present for a good opportunity to the long side. Combined they presented a great combination for a very well defined trade. Moving forward, we are now able to see what sort of potential a trade like this may have. 


Comment

Life "Support" - Part 1

Life "Support" - Part 1

Markets can remain irrational longer than you can remain solvent.
— John Maynard Keynes

I'd like for you to read the quote at the top of the page and let it soak in. Take a few moments and read it over and over and out loud if you have to so that you can become a believer in that statement. There is no greater cause for money lost than conviction in the wrong direction. This post goes hand in hand with the first post of this thread "Stick to the Plan." 

The purpose of this post is to reassure you that neither I, nor you, nor your mom, nor your best friend, nor Goldman Sachs, nor the Market Maker, nor Warren Fucking Buffett know where the market will ultimately go. We have our charts, our technical analysis, our valuations, and we play the odds but ultimately that is all we are doing -- playing odds in our favor. 

The stock market's prices are strictly an indication of future value based on speculation. As such, the "game" of speculation is determined based on future favor. Simply put, an equity's price is basically what people are willing to pay for it now  based on where think the company's value will go later. That said, how is a stock's price often determined? Let's address this below. 

People often mistake a company's market cap as the value of the company. That is not only wrong, but it will certainly mislead you into believing a company is good/bad depending on its size. A company's market cap is simply the total dollar value of a company's outstanding number of shares. In layman terms, market cap is the total number of shares a company has x the stock price. 

  • Market Cap Example: Company A has 500 shares available for sale at $2.00/share. Company A's Market Cap is $1000.00.


So what's the point? Why does any of this even f'ng matter? 


The point of this is to remind you that when you're wrong (you being everyone, myself included) you need to admit defeat quickly and get out of your false assessment. Markets move irrationally, and when that irrational behavior takes over against you, it will cost you more than you'd typically imagine. I will highlight this irrational behavior below with several examples, some present and some from previous days. To start, I will highlight the craziest one of them all -- the Tulips. 


TULIP0MANIA


For those of you who don't know, Tulip Mania or Tulipomania was a period during the Dutch Golden Age where in 1593 tulips (yes the flower) was brought over to Holland from Turkey. They started off as a novelty and the flower quickly became sought after and ultimately pricey. Fast forward a bit and the flowers contracted a virus called mosaic that didn't kill the flower, but instead changed them causing "flames" of color to appear on the flower petals. This made the flowers more "rare" and "unique" flowers. This ultimately drove the price of the flowers through the roof. The flowers were subsequently priced based on how their virus alterations were valued, or desired. Seriously, people were putting different prices on the same flower because they thought one was more valuable than the other. Soon after, everyone began "dealing in bulbs" and boom a speculative tulip market was created and believed to have no limits. 

Bulb buyers (the garden centers of the past) soon started to fill up inventories for the growing season. This only limited the supply further and increased the demand and "scarcity" of the tulip.


That's when supply and demand took over and irrational exuberance set in.  


Prices started rising so fast and high that people were selling and trading their land, life savings, and their loved ones (joking here... I think) so they can get their hands on more tulips. 

Now if you think I sound like I'm crazy you're right. I sound like I'm fucking nuts. But sadly I'm not, and I'm not making it up either. That really happened. So how high do you think the cost of a tulip bulb went in the 1600's? 

  • $20?

  • $30?

  • $50?

I wish it stopped there. 

Prices moved nearly 20-fold in a month in an already insanely overpriced market. At it's manic peak, an average bulb could be sold for 160-200 Guilders.  


Put into perspective at today's prices, tulip bulbs (even the bad ones) sold between $48,000 and $64,000.


Tulip prices From November 12 1636-May 1 1637.

The point I'd like for you to take away from this is that markets set themselves. Let your positions run as long as you can afford to, respect your stops, and never think you won't have another opportunity like this again. It takes two sides to make a market and in doing so the market is always binary and always wins. Secondarily, whether it’s tulip bulbs, houses, .com stocks, crypto assets, or any other future novelty that will come; this shit is nothing new. It is all the same. The intrinsic value of whatever asset you hold is determined based on the scarcity of the supply and the perceived value at any given time. With any asset or store of monetary value there is always an inflection point where the risk paradigm skews in favor of releasing the “asset” and returning to “cash.” Cash here is in quotation marks to account for the different permutations of “cash” that have existed and will exist throughout time.

In the next post we'll cover the previous story using other, more practical, examples. 

F.A.N.G. Bites (N)

Comment

F.A.N.G. Bites (N)

It's almost comical how bullish the sentiment still is on days like today where the market is not slip n' sliding to fresh session lows. This especially holds true for the F.A.N.G. stocks where fan boys (and girls) spend excessive amounts of time telling you where the future of the stocks they love will be. For those of you that don't know, F.A.N.G. is a nifty little acronym that Wall St. gave to its four leaders Facebook (FB), Amazon (AMZN), Netflix (NFLX), and Google (GOOG/GOOGL). It rolls right off the tongue and makes it easier to fall in love with the stocks. 

Cool name or not, these stocks are not performing since they topped out as of late. I want to take a look at them individually using multiple time frames starting with Netflix (NFLX). 

Netflix has been the true leader of the group and the market, so I want to start here. Let's first take a look at NFLX's chart for the last two years on a monthly basis. As you'll see, we have a rally for about a year followed by a base for almost a year and finally a resolution to the upside. Once the issue resolved to the upside, the move was quite violent breaking far away from trend. So long as the trend was in tact, the issue continued to climb. 

In mid July however, the issue struggled to make new highs and topped off around the 130 level. The monthly, weekly, and daily charts all signal this top off and a precipitous decline ensued. This decline was accelerated when the trend NFLX built since the start of the year was breached. 

Currently you'll notice that the highs are getting lower and NFLX appears to be descending in a downward channel. Areas of support are noted with the blue horizontal lines. 

NFLX Bullish rally on monthly followed by a reversal. Echoed in the weekly and daily charts. New downtrend illustrated in daily chart.

Comment