Viewing entries in
Earnings

Can You Hear Me Now?

Can You Hear Me Now?

The current Capital IQ Consensus Estimates call for Q2 EPS of $0.94 and revenues of $3.09 bln. VZ expects full year 2016 adjusted earnings to be comparable to the co's full year 2015 adjusted earnings of $3.99 EPS

$GILD Earnings Preview

$GILD Earnings Preview

Gilead Sciences is scheduled to report 2Q16 earnings on July 25 after the market closes. 

Consensus calls for 2Q16 EPS of $3.01 (vs. $3.15 last year) with revenue down 4.9% to $7.8 bln.


  • The stock trades at just 7.3x FY16 EPS estimates as investors demand growth (similar story to that of AAPL). Sales and earnings are expected to fall ~4% this year. Earnings are expected to grow ~2% next year with sales down 1% as the co aggressively buys back shares.
  • Investors want the co to acquire its next blockbuster drug. Last month, the CFO said it has the balance sheet to acquire a large oncology asset. Gilead bought back $15 bln shares in FY15 and commenced a $12 bln share buyback in FY16, purchasing $8 bln worth of shares in 1Q16.

FY16 Guidance

The co reiterated FY16 guidance below Consensus on April 28 when they reported 1Q16 earnings. Capital IQ Consensus calls for a 2.5% decrease in FY16 rev to ~$31.8 bln, compared to $32.6 bln in FY15.

  • Net product sales: $30-31 bln
  • Adj Product gross margin: 88-90%
  • Adj R & D expenses: $3.2-3.5 bln
  • Adj SG & A expenses: $3.3-3.6 bln
  • Adj Effective tax rate: 18%-20%

1Q16 Recap

  • The co reported 1Q16 earnings of $3.03/share, $0.10 worse than the Capital IQ Consensus of $3.13, rev rose 2.6% y/y to $7.79 bln vs the $8.07 bln Consensus.

Technical Analysis

Technically, GILD has been an under-performer since its last earnings report in April had its selling back down to its early Jan/Feb lows around the $82 area. Buyers will want to clear this 87/88 resistance and lift price back into the late-April bearish gap between the 92/96 zone.

The 200-day moving averages are also in play around 91/92. Sellers will simply want to keep the pressure on by dropping the stock back towards this year's lows in the 78/82 range.

Implied Vol

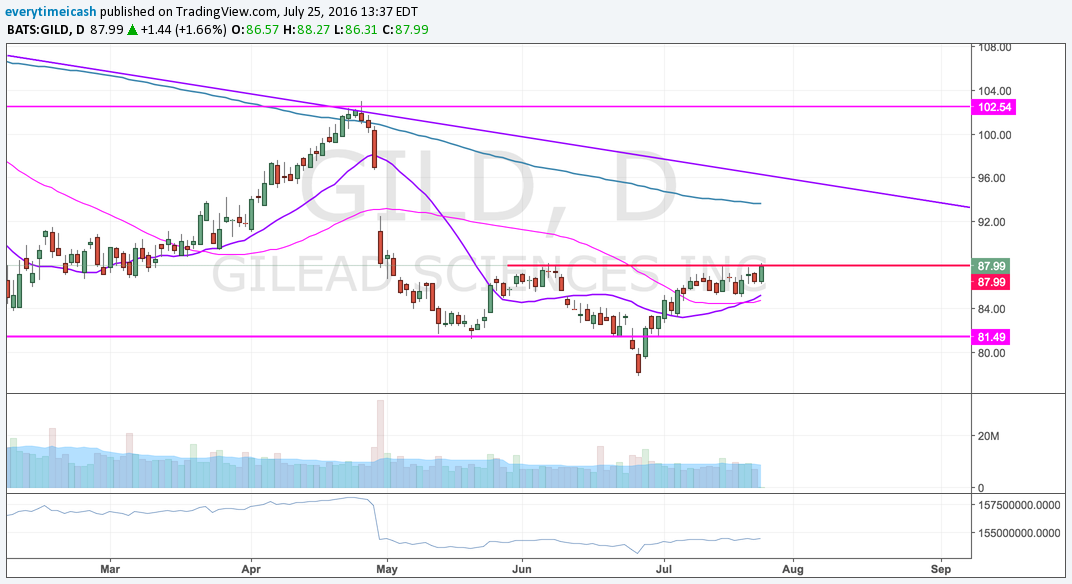
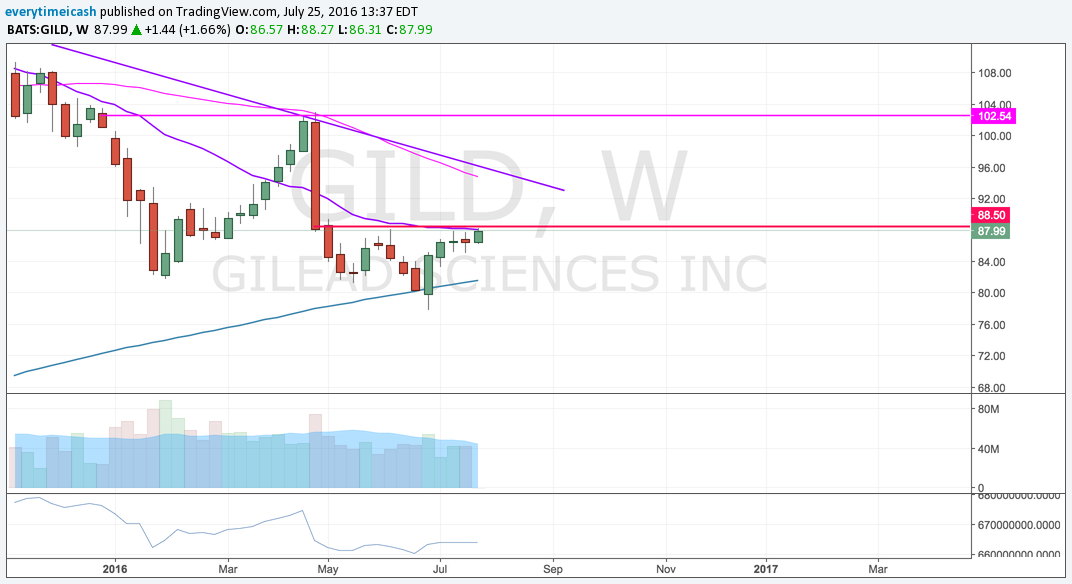
Based on GILD options, the current implied volatility stands at ~ 29%, which is 14% higher than historical volatility (over the past 30 days). Based on the GILD Weekly Jul29 $86.5 straddle, the options market is currently pricing in a move of ~5% in either direction by weekly expiration (Friday).


Click here to listen to my podcast and learn more about my theory on relationships and the stock market.


$UA Earnings Preview

$UA Earnings Preview

Under Armour (UA) reports Q2 results tomorrow July 26 followed by conference call at 8:30am ET.

Current consensus is for Q2 EPS of $0.02, operating income of ~$19 mln on revs +28% to $1.00 bln (guided for revenues in high 20s, operating income of ~$17-19 mln and flat gross margin). Since becoming a publicly traded company, UA has never missed earnings estimates.


Last quarter, Under Armour beat Q1 EPS estimate by $0.02, reported revs in-line, guided Q2 operating income / revenues in-line and slightly raised FY16 guidance / reaffirmed margin guidance.

Headed into the print: UA has held onto these recent gains and is back near pre-Q1 levels. 

Based on UA options, the current implied volatility is 14% higher than the historical volatility (over the past 30 days). UA Weekly Jul29 $42.5 straddle is currently pricing in a move of ~8% in either direction by weekly expiration (Friday).

Key metrics and areas of interest:

  • Current Quarter: Following the decision of the bankruptcy court to approve the liquidation of The Sport Authority's business rather than a restructuring or sale, Under Armour determined to recognize a Q2 impairment charge of ~ $23 mln and updated its Q2 and FY16 outlook. The company reaffirmed Q2 revenue growth in the high 20s but revised operating income to $17-19 mln (prior $40-42 mln) as a result of the impairment.
  • Guidance: The Sport Authority mid-quarter update included revised 2016 guidance for operating income to ~$440 -445 mln (prior +23-24% to $503-507 mln) on net revenues +24% to $4.925 bln (prior +26% to $5.0 bln). Updated outlook will be included in the earnings press release - estimates are tracking slightly ahead of the this prior outlook with operating income of +11% to ~$453 mln estimate and revenues +25% to $4.96 bln.

Techs:


Click here to listen to my podcast and learn about my theory on the similarities between relationships and the stock market.


Homes and Big Macs

Homes and Big Macs

Close to 40% of the S&P 500 will report their quarterly results this week. That includes McDonald's, which will report before the open on Tuesday. 

Mall Cop ($M Earnings)

Mall Cop ($M Earnings)

Q1 Expectations: EPS of $0.37 vs $0.56 year ago on sales -4.3% y/y to $5.96 bln.

Staring at the Sun ($SCTY Earnings)

Staring at the Sun ($SCTY Earnings)

Solar City (SCTY) is set to report Q1 results tonight after the close with a conference call to follow at 5pm ET.

Current Capital IQ consensus stands at a loss of ($2.37) on revenue of $110 mln.

Investors are still nervous following the Q4 results which saw the stock sell off sharply after the co posted soft installations Q4 results and Q1 guidance.

The company was unable to address the concerns around an increase in financing costs. They did announce two new refinancing deals this quarter which helped ease tensions.

Investors would like to see an in-depth update on financing costs and an update on installations in order to be enticed back into the stock.

Key Metrics

  • MW Installed- SCTY guided for 180 MW which was below expectations and represented an 18% y/y decline and 34% q/q decline. Co reaffirmed its 2016 MW outlook for 1.25 GW. Q1 usually sees some seasonal weakness. Q4 came in at 272 MW (Guidance was 280-300 MW), +54% y/y. Co had 15 MW of projects pushed out of Q4 that were expected to be completed in Q1.
  • MW Deployed- Q4 came in at 253 MW, +44% y/y.
  • Cost per Watt- Q4 was $2.71, -5% y/y.
  • Value of MW deployed- Q4 was $3.64 per watt.

Guidance

  • SCTY continued to target 1.25 GW Installed for 2016
  • The primary focus of company in 2016 is goal of generating positive cash by year-end. Wants to achieve a state where it can self-sustainably install new MW without cash balance declining.
  • For Q1 2016 SCTY expects to install 180 MW, representing growth of 18% y/y, and a 34% decline q/q. This represented a higher-than-usual seasonal slowdown that it has historically experienced.
  • For Q1 2016, expect GAAP Operating Expenses of $230-240 mln.
  • SCTY sees Non-GAAP Loss Per Share between ($2.55) -- ($2.65).

TECHS:


RESULTS:

SolarCity misses by $0.19, beats on revs; guides Q2 EPS below consensus, revs below consensus 

  • Reports Q1 (Mar) loss of $2.56 per share, excluding non-recurring items, $0.19 worse than the Capital IQ Consensus of ($2.37); revenues rose 81.6% year/year to $122.57 mln vs the $110.02 mln Capital IQ Consensus.
    • MW Deployed 214 MW, +40% y/y (Guidance was for 180 MW).
      • "We significantly exceeded our projected 180 MW mostly due to the earlier completion of a large utility-scale project in Maryland that was originally anticipated for Q2 2016".
    • Cost per Watt of $3.18 increased 19% from the fourth quarter of 2015 largely owing to lower volumes. Installation costs decreased 6% year-over-year, albeit rising 3% quarter-over-quarter to $1.98 due strictly to a larger mix of higher cost commercial projects.
    • structured financed team recorded one of its strongest quarters yet with $728 million in total project financing raised in the quarter (and $1.1 billion through April).
    • Portfolio is 74% residential and 26% C&I and is geographically diversified across 18 states plus D.C. (38% East Coast, 34% California, 13% Arizona, 8% Nevada, and 7% other).
    • 'As this was not only our first transaction but also covered a portfolio that had a higher mix of C&I projects with 10- 15 year contract lengths than we typically install, we view this weighted average cost of capital as a starting point that will trend lower on subsequent transactions and ultimately expect this to be an important new channel for financing our growth in the future'.
    • Consolidated Gross Margins were 11%. Operating expenses were $227 million, up 54% year-overyear
  • Co issues downside guidance for Q2, sees EPS of ($2.80)-($2.70), excluding non-recurring items, vs. ($2.23) Capital IQ Consensus Estimate; sees Q2 revs of $135-143 mln vs. $152.39 mln Capital IQ Consensus Estimate.
    • Expect GAAP Revenue from Periodic Billings of $105-108 million,
    • Solar Energy Systems and Components Sale Revenue of $14-16 million,
    • Revenue from Operating Lease Prepayments and Upfront Incentives of $16-19 million.
    • Operating Expenses are forecast to range between $240 million and $250 million
    • Co sees 185 MW deployed, down 2% y/y.
  • Remain on target for our cost goal of $2.25 per Watt in 2017.
  • Well positioned to achieve goal of generating positive cash by year-end even as we continue to add MW to our portfolio and incur cash expenditures for both research and development activities and our module manufacturing operations.

Over-Rated ($YELP Earnings)

Over-Rated ($YELP Earnings)

Analyst estimates call for EPS of $0.03, Revs +31.2% y/y to $155.53 mln. Expectations are in-line with the company's provided guidance from their Q4 report for revenues of $154-157 mln. 

Big Rig ($RIG Earnings Preview)

Big Rig ($RIG Earnings Preview)

Consensus for RIG calls for earnings of $0.28 and revs of $1.1 bln. If realized, that would be an EPS decrease of -75% from $0.96 and a revenue decrease of 46.2% YoY from $2.04 bln

For RIG, what matters most is the spending of oil explorers and producers. Capital spending for this group has been cut over and over again by many companies since last year, which hurts companies in the drilling and oil service and equipment industries.

For now, oil drillers are aiming to reduce costs to help try and weather the oil slump. But there may be a little relief as the oil rig count, as measured by Baker Hughes (BHI), is expected to bottom in the second quarter.

The most recent weekly oil rig count data, released last Friday, showed that oil rig fell for a sixth consecutive week and are now down at levels not seen since 2009.

Q4 recap:

  • Co reports Q4 earnings of $1.68 per share on Feb 24, excluding non-recurring items, $1.04 better than the Capital IQ Consensus of $0.64; revenues fell 17.3% year/year to $1.85 bln vs the $1.41 bln Consensus
  • Other revenues increased $356 million due to early contract terminations on the Polar Pioneer, Discoverer Americas, and Sedco 714
  • Contract drilling revenues decreased $113 million due to reduced activity and rig retirements partially offset by higher ultra-deepwater revenue efficiency and higher demobilization revenues
  • Capital expenditures totaled $665 million, down from $940 million in the prior quarter 

Getting FIT

Getting FIT

Fitbit (FIT) is set to report earnings tonight after the close with a conference call to follow at 5pm ET.

Current consensus stands at EPS of $0.03 on revenue of $440 mln.

Key Metrics

  • Gross Margin- FY16 Guidance is for the range of 48.5-49.0%; Q4 was 50.0%.
  • Active Users- Q4 saw it increase 152% to 16.9 mln; Economies of Scale will press this number lower but the rate will be closely watched.
  • Sales & Marketing- With the launch of two new products, FIT noted that this expense would see an increase. Q4 came in at $15.7 mln.
  • Devices: FIT sold 8.2 mln health and fitness decvices in Q4, up 54% y/y.

Q1 Guidanc

  • EPS expected to be in the range of $0.00-0.02.
  • Revenues expected to be in the range of $420-440 mln.

FY16 Guidanc

  • FY16 EPS expected to be in the range of $1.08-1.20
  • Revenue expected to be in the range of $2.4-2.5 bln.

Electric Slide ($TSLA Earnings Preview)

Electric Slide ($TSLA Earnings Preview)

Tesla will report Q1 results after the bell in a letter to shareholders on its website; conference call starts at 16:30.

The Street is expecting Q1 non-GAAP EPS of ($0.68) vs. ($0.36) last year with non-GAAP rev +45% to $1.6 bln.

Tesla pre-announced Q1 deliveries below guidance due to supply/production issues with the Model X.


Guidance:

  • Because production is now on plan and Q1 orders exceeded Q1 deliveries by a wide margin, with Q1 Model S orders being 45% higher than Q1 last year, Tesla reaffirmed its full-year delivery guidance of 80-90K vehicles. By year-end, Model S gross margin should begin to approach 30% and Model X gross margin should be about 25%, with continued improvement for Model X in 2017. Tesla also guided for op-ex up 20% YoY.
  • Tesla may have to raise capital sometime this year given its cash burn. Model 3 deliveries are targeted for late 2017 but they won't start in earnest until 2018. Musk has said Tesla learned from its mistakes in missing Model S and Model X production targets.

TODAY:

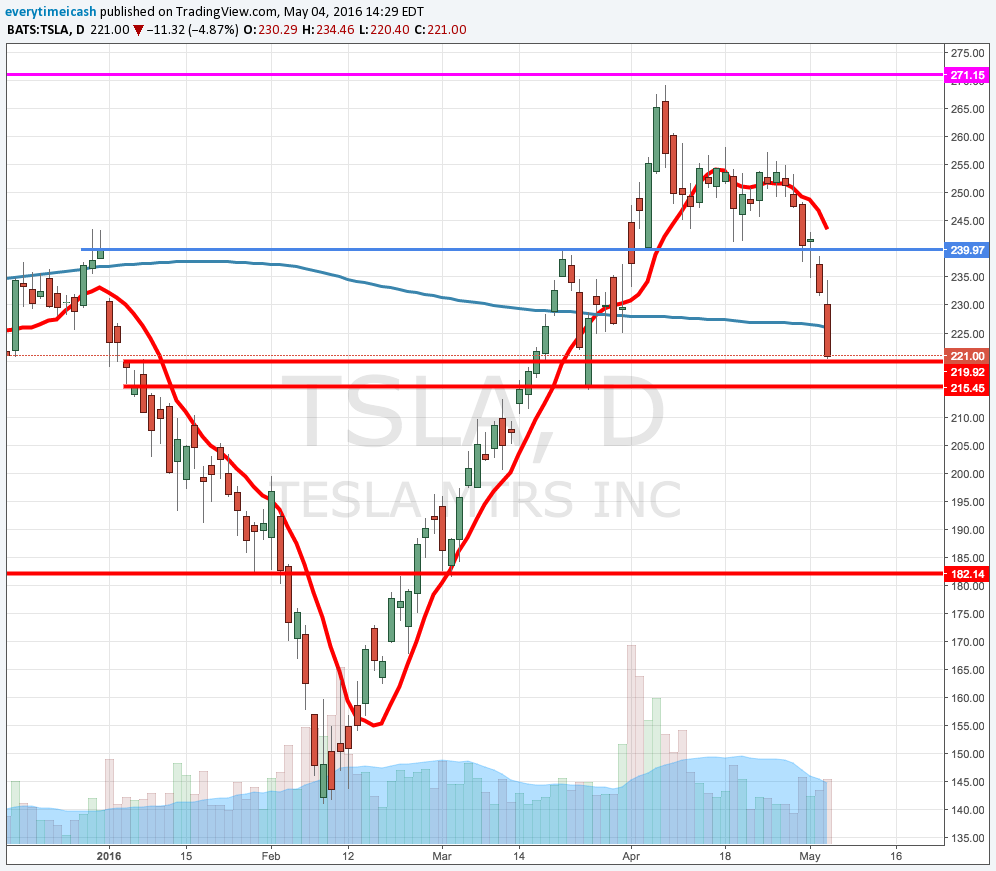
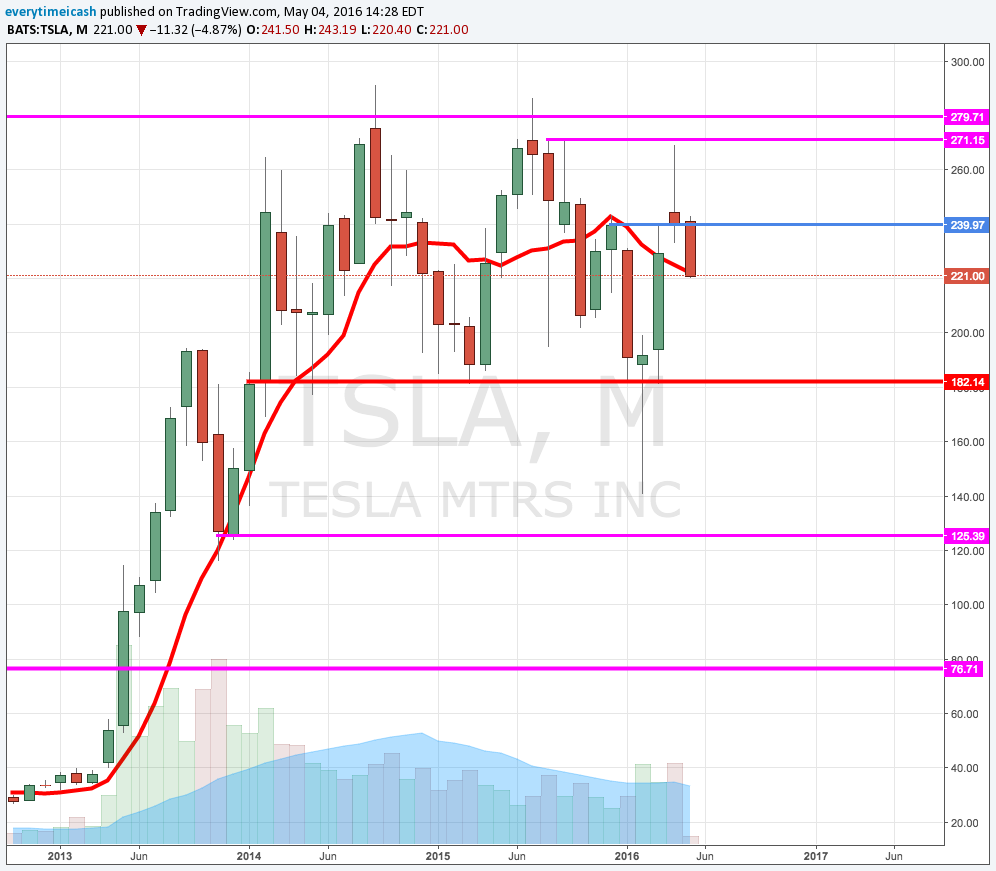
TSLA fell back below the critical 240 level in the market's recent pullback. Shares have come under pressure today following reports that two VPs of manufacturing are leaving the company. 

Shares are trading lower by $10.15 at $222.17 in Wednesday's session. The double whammy of hedge fund manager Jim Chanos and high level exiting the company has longs extremely nervous about its Q1 report due out after the close.

RESULTS:

  • Reports Q1 (Mar) loss of $0.57 per share, excluding non-recurring items, $0.10 better than the Capital IQ Consensus of ($0.67); revenues rose 45.1% year/year to $1.6 bln vs the $1.6 bln Capital IQ Consensus. 
  • Preannounced Q1 deliveries of 14,820, below 16K guidance and Model S orders +45% on April 5th.
  • In Q2, we expect to produce about 20,000 vehicles, representing a sequential increase of nearly 30%, and will deliver as many of these cars as we can in Q2, with the rest being delivered in Q3. Due to a large number of vehicles in transit to customers in Europe and Asia at end of quarter, Q2 deliveries are expected to be ~17,000 vehicles. Importantly, now that supply chain constraints have been resolved, we plan to exit Q2 at a steady production rate of 2,000 vehicles per week, thus laying the foundation for a strong Q3 delivery number.
  • Looking out beyond Q2, we remain confident that we can deliver 80,000 to 90,000 new Model S and Model X vehicles in 2016. This is due to the growing demand we are seeing for Model S and Model X, the improved rate of production that we project for Q2, and the production increases planned for the back half of 2016. Model S cost reductions and improving Model X manufacturing efficiency should cause Automotive gross margin to increase. We are on plan for Model S non-GAAP gross margin to approach 30% and Model X non-GAAP gross margin of about 25% by year-end, with higher Model X gross margin in 2017. 
  • Given the demand for Model 3, we have decided to advance our 500,000 total unit build plan (combined for Model S, Model X, and Model 3) to 2018, two years earlier than previously planned. Increasing production five fold over the next two years will be challenging and will likely require some additional capital, but this is our goal and we will be working hard to achieve it. We remain on plan to make the first cells at the Gigafactory in Q4 2016, and we are adjusting our plans there to accommodate our revised build plan.
  • Given our plans to advance our 500,000 total unit build plan, essentially doubling the prior growth plan, we are re-evaluating our level of capital expenditures, but expect it will be about 50% higher than our previous guidance of $1.5 billion for 2016. Naturally, this will impact our ability to be net cash flow positive for the year, but given the demand for Model 3, investing to meet that demand is the best long-term decision for Tesla. Non-GAAP operating expenses should increase by about 20- 25%, up from +20%.

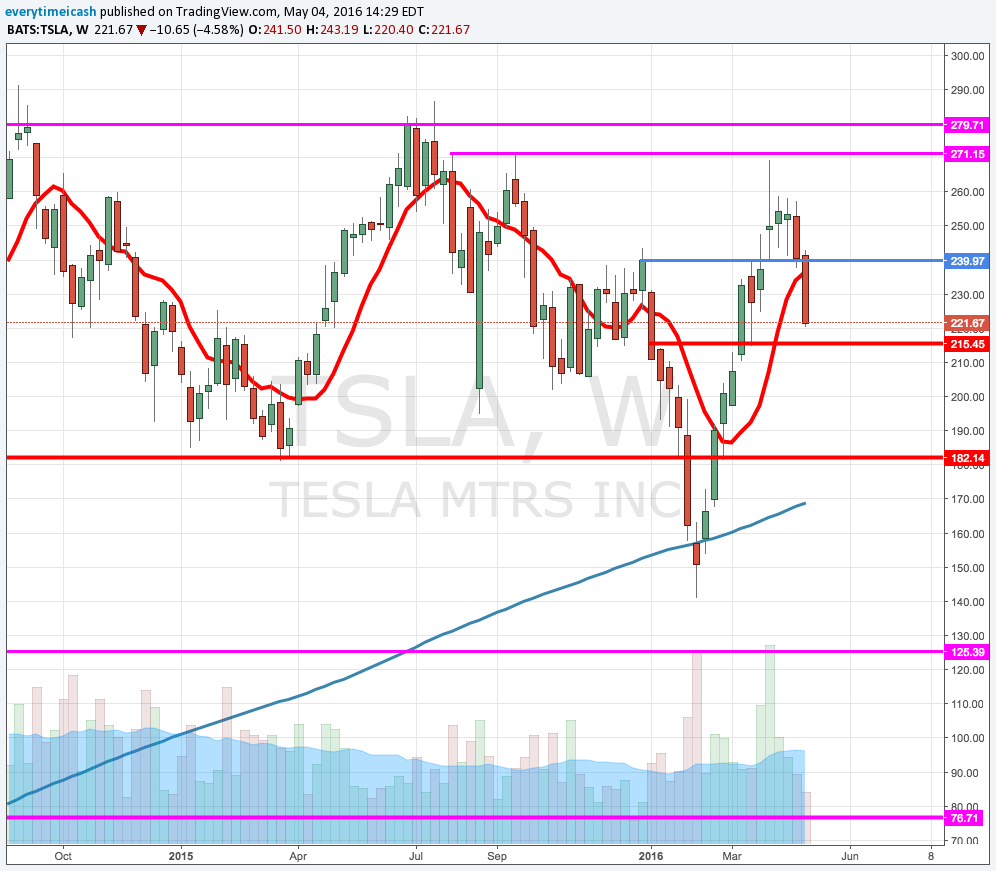
Tesla Motors (TSLA) reported largely in-line Q1 results last night after the company preannounced Q1 deliveries below guidance last month due to Model X production issues. More importantly, Tesla announced very aggressive production targets that seemingly make a capital raise inevitable.

Encouragingly, production has picked up and demand for the Model S accelerated in Q1, with orders up 45% year over year.

Tesla now plans to build 500K vehicles (Model S, X and 3) in 2018, two years earlier than previously planned. Tesla is planning to build 100-200K Model 3s in the second half of 2017. Elon Musk said there is a high probability you will receive your Model 3 in 2018 if you place a reservation right now. Before last night's news, analysts may have assumed a new reservation wouldn't land you a Model 3 until 2019.

Notably, many were skeptical that Tesla could hit the 500K target in 2020.

As a result, Tesla raised operating expense (to 20-25% growth from +20%) and capital expenditure guidance (~50% from $1.5 billion previously) and backed off its non-GAAP profitability and positive free cash flow targets for 2016.

Both the Bulls and Bears have something to chew on by this news. Bears will say it's an unrealistic product target that will require an excessively dilutive capital raise. But TSLA bulls have faith in their ambitious CEO. Successful execution will put the company even further ahead of the incumbent auto makers in the electric vehicle market and even the tech giants like Apple and Google planning an entrance in the auto market.

Tesla is now even more so a story of manufacturing execution. Much faith is required in Elon Musk, especially at this $28 billion valuation.

Tesla shares are 5% lower today after Elon Musk raised the stakes yet again and signaled an inevitable capital raise.

Late For Work ($LNKD Earnings Preview)

Late For Work ($LNKD Earnings Preview)

'Yeah, so the online business, it has been decelerating over the last few years. It's a structural decel, if you look at our Subs business in the aggregate... the trajectory of the online business is it's been pretty linear in terms of the year-on-year growth rate.'

It's Amazin ($AMZN)

It's Amazin ($AMZN)

Amazon.com (AMZN) is set to report Q1 earnings today after the close today followed by conference call at 5pm ET. 

Dime Life ($POT Earnings Preview)

Dime Life ($POT Earnings Preview)

POT will be releasing its Q1 earnings results tomorrow pre-market with a call tomorrow at 1:00pm ET. Consensus for POT calls for EPS of $0.15 and revs of $1.1 bln. If realized, that would be an EPS decrease of 66% and a revenue decrease of 29% YoY.

  • Co provided full-year 2016 guidance of $0.90-$1.20 per share.
  • Co also forecasted Q1earnings will fall in the range of $0.10-0.20/share.

Co reported, on Jan 28, Q4 earnings of $0.24 per share, $0.07 worse than the Consensus of $0.31; revenues fell 28.8% year/year to $1.35 bln vs the $1.37 bln Consensus


A big issue all fertilizer companies have is the recent weakness in farmer cash receipts. This hurts product companies like POT. And, potash prices remain weak driven by both demand and supply issues. Nitrogen prices are struggling as well.

Co expects global potash shipments in the range of 59-62 million tonnes, in line with 2015's total of ~60 million tonnes, but above current demand expectations.

Overall, Potash (POT) doesn't just sell potash. The co sells potash, nitrogen and phosphate. Following is the breakdown of how much each contributes to the co's gross margin. 

POT's gross margin exposure by segment: Potash = 56%, Nitrogen = 33%, Phosphate = 11%.


POT's sales volume by region:

  • Potash- North America = 34%, Offshore = 66%

  • Phosphate - North America = 62%, Offshore = 38%

  • Nitrogen- North America = 87%, Offshore = 13%

Other fertilizer stocks include AGU, BG, CF, UAN, IPI, TNH, MOS, RTK, RNF. POT's closest peers.

POT has 2.27k May 17.5P trading today.

Like Me ($FB Earnings Preview)

Like Me ($FB Earnings Preview)

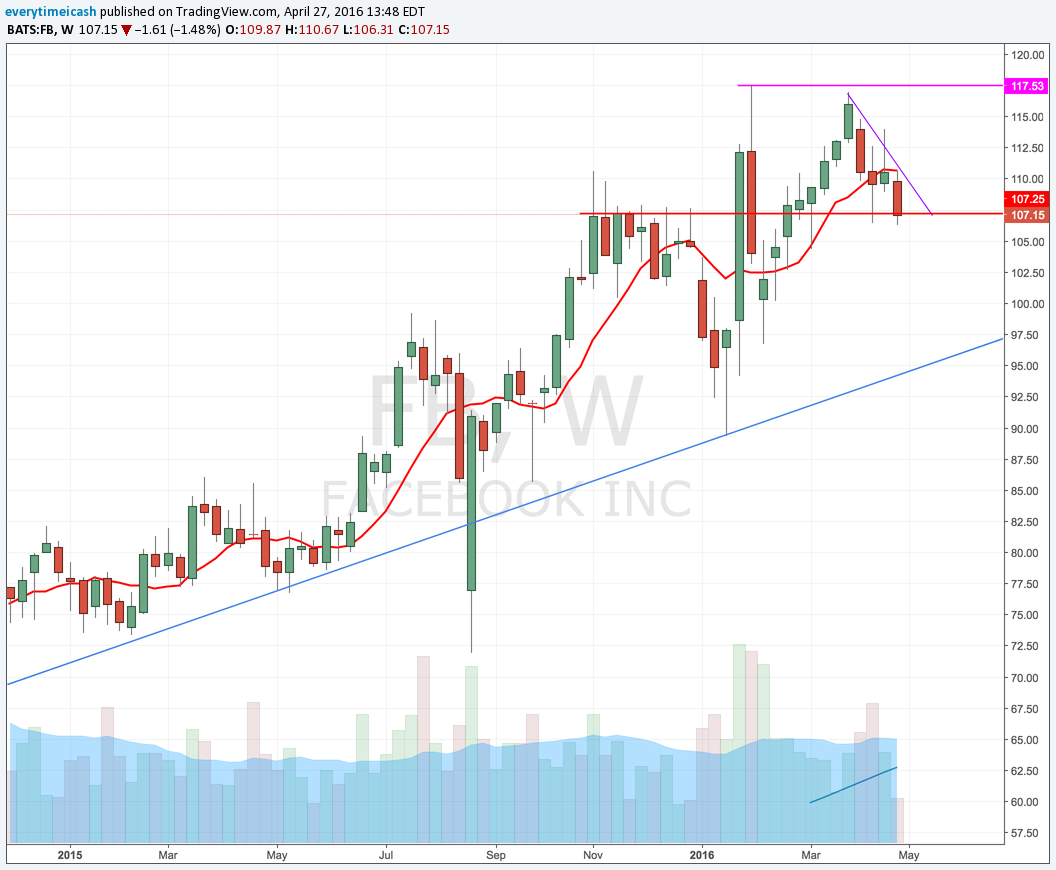
Unlike many other companies, expectations for Facebook remain quite high.  Failure to meet those expectations could cause a material decline in its stock, which is up 31% over the last 52 weeks.

Ad spending drives Facebook's top line, accounting for 95% of the company's revenue in 2015. FB is a barometer for how advertisers are spending and where they are allocating their advertising budgets.

Facebook has a large international presence with 86% of its 1.59 billion monthly active users at the end of 2015 residing outside the U.S. and Canada and 50% of its total 2015 revenue derived outside the U.S. and Canada. Facebook, then, will have some revealing insight to share on global economic activity and the impact of foreign currency on its operating results. 

Facebook is a leadership stock for the Nasdaq and Nasdaq 100. The company and its stock serve as guides for the enthusiasm surrounding the growth of social media

  • Facebook had 1.59 billion monthly active users as of December 31.  Any company with that many users/customers warrants a closer look when it reports earnings.
     

FB 4th Quarter: 

  • Daily active users (DAUs) were 1.04 billion on average (+17% year-over-year); mobile DAUs were 934 million on average (+25% year-over-year)
  • Monthly active users (MAUs) were 1.59 billion (+14% year-over-year); mobile MAUs were 1.44 billion (+21% year-over-year)
  • The average price per ad was up 21% while total ad impressions increased 29% year-over-year; that was the first quarter since Q3 2013 that total ad impressions increased on a year-over-year basis
  • Faces tougher comparisons given the strong 2015 performance
  • 2016 will be another significant investment year for Facebook
  • Guidance
    • Non-GAAP expense growth of ~45-55% year-over-year
    • Sees capex in the range of $4.0 billion to $4.5 billion
    • Expects to see FX headwinds, particularly in the first half of the year due to tougher comparisons
       

Tough to be short this stock into earnings, especially at this point.

Affected Stocks:

  • FB
  • Alphabet (GOOG/GOOGL)
  • Twitter (TWTR)
  • LinkedIn (LNKD)
  • Yelp (YELP)
  • PowerShares QQQ Trust (QQQ)
  • Global X Social Media Index ETF (SOCL)
    • FB is largest holding at 12.3% of assets


RESULTS:

Facebook beats by $0.15, beats on revs  

  • Reports Q1 (Mar) earnings of $0.77 per share, $0.15 better than the Capital IQ Consensus of $0.62; revenues rose 51.8% year/year to $5.38 bln vs the $5.26 bln Capital IQ Consensus.
    • Advertising revenue increased 57% y/y to $5.2 bln.
  • Daily active users (DAUs)- DAUs were 1.09 billion on average for March 2016, an increase of 16% year-over-year.
    • Mobile DAUs- Mobile DAUs were 989 million on average for March 2016, an increase of 24% year-over-year.
  • Monthly active users (MAUs- MAUs were 1.65 billion as of March 31, 2016, an increase of 15% year-over-year.

    • Mobile MAUs- Mobile MAUs were 1.51 billion as of March 31, 2016, an increase of 21% year-over-year.

  • Mobile advertising revenue- Mobile advertising revenue represented approximately 82% of advertising revenue for the first quarter of 2016, up from 73% of advertising revenue in the first quarter of 2015.
  • Capital expenditures- Capital expenditures for the first quarter of 2016 were $1.13 billion.
  • Free cash flow for the first quarter of 2016 was $1.85 billion.

🔥🔥MONSTER QUARTER, AGAIN. THEY'RE KILLING THEIR "COMPETITION"🔥🔥


Facebook announces proposal of new class of stock

FB announced that the board of directors has approved a proposal to amend and restate existing certificate of incorporation to create a new class of non-voting capital stock, known as the Class C capital stock.

If approved, it will issue two shares of Class C capital stock as a one-time stock dividend in respect of each outstanding share of our Class A and Class B common stock. This proposal is designed to create a capital structure that will encourage Mr. Zuckerberg to remain in an active leadership role at Facebook. 

The adoption of the proposal is subject to the approval of our stockholders at our 2016 Annual Meeting of Stockholders to be held on June 20, 2016.
— FACEBOOK

Facebook Conference Call Highlights

  • Apps continue to show momentum.
  • Mobile continues to drive growth.
  • Mobile ads being driven by supply and demand; demand- investments to improve solutions

Q1 Avg Price per ad increased 5%; total ad impressions increased 50%; strong growth in mobile ad impressions.

  • Will face tougher comps in 2016 given acceleration of ad growth in 2015
  • Payment fees revenue will also see headwind even with Oculus; expects y/y decline.
  • Expense Outlook remains unchanged at Non-GAAP growth of 45-55%; Amortization will be $700-800 mln; SBC $1.1-1.3 bln in 2016; CapEx will be at the high end of $4.0-4.5 bln range previously given; Q2 and FY16 tax rates should be similar to Q1. 

FB breaks through all time high on stellar report, again. 

$FB prints 119.44 ALL TIME HIGH after hours.

Online Dusty Attic ($EBAY Earnings Preview)

Online Dusty Attic ($EBAY Earnings Preview)

eBay (EBAY) is set to report Q1 results tonight after the close with a conference call to follow at 5pm ET. 

Current Consensus stands at EPS of $0.45 on Revenues of $2.08 bln.

Shares of EBAY were blasted following the Q4 report. EBAY managed to report an in line quarter, but downside guidance to both Q1 and FY16 led to selling pressure that would drop the stock 13%. EBAY shares were able to settle at the $22 level in mid-February and have been able to climb back toward $25 ahead of tonight's report.

An attractive valuation has been the primary driver for the move back through the post-earnings gap down. An attractive valuation is all that's saving the stock right now.

Guidance

  • EBAY expects Q1 revenue in the range of $2.05-2.10 bln; Sees EPS in the range of $0.43-0.45
  • FY16 EPS in the range of $1.82-1.87; Sees revenues in the range of $8.5-8.8 bln.

Key Metrics

  • Total Gross Merchandise Value- Q4 was $21.86 bln which was flat y/y and up approx 11% q/q.
  • Operating Margin- Q4 saw its OpMargin fall 230 bps to 34.4% as FX headwinds and increased competition weighed on results.

Q2 Recap

  • EBAY reported Q4 (Dec) earnings of $0.50 per share, excluding non-recurring items, in-line with the Capital IQ Consensus of $0.50. Revenues were unchanged from the year-ago period at $2.32 bln.
    • GMV was ~flat at $21.9 bln.
  • Co issued downside guidance for Q1, seeing EPS of $0.43-0.45, excluding non-recurring items, vs. then-$0.48 Capital IQ Consensus Estimate; Co projected Q1 revs in the range of $2.05-2.10 bln vs. then-$2.16 bln Capital IQ Consensus Estimate.
  • Co issued downside guidance for FY16, seeing EPS of $1.82-1.87, excluding non-recurring items, vs. then-$1.98 Capital IQ Consensus Estimate. Co projected revenue in the range of $8.5-8.8 bln vs. then-$9 bln Capital IQ Consensus Estimate.
    • EBAY said that it may seek additional outside financing to replace 2016 maturities and provide financial flexibility. So we would be on the look out for any refinancing.
    • EBAY said it expected to continue buying shares throughout 2016, at or above the rate of 2H15. This would be in addition to offsetting dilution. EBAY repurchased $550 mln shares in Q4.