Viewing entries in
Stock Market

Juice Cleanse

1 Comment

Juice Cleanse

The fruits of your success will be in direct ratio to the honesty and sincerity of your own effort in keeping your own records, doing your own thinking, and reaching your own conclusions.
— Jesse Livermore

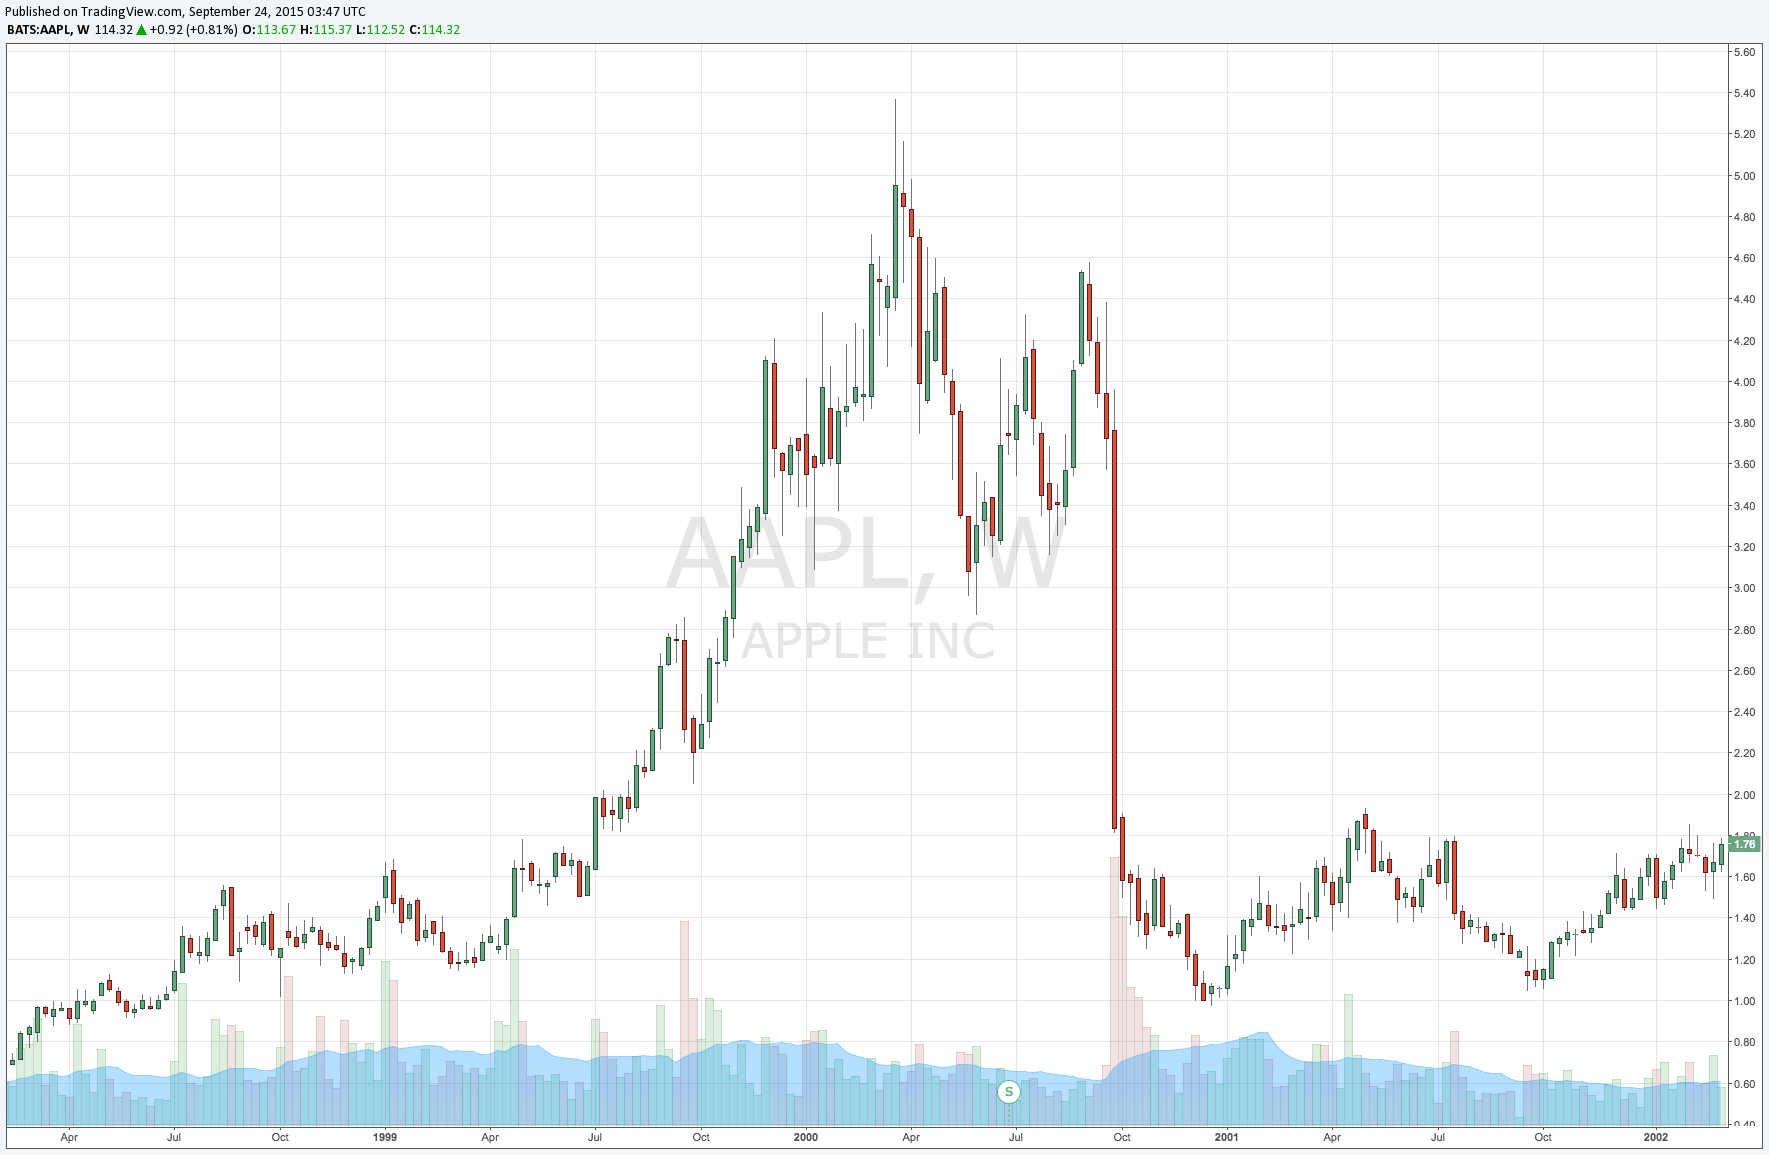
If the Wall St. narrative runs its course, something definitely has to give with AAPL. The issue, which has traded poorly since making an all time continues to do so. If you have not yet, you should start to consider what your threshold tolerance for pain should be.

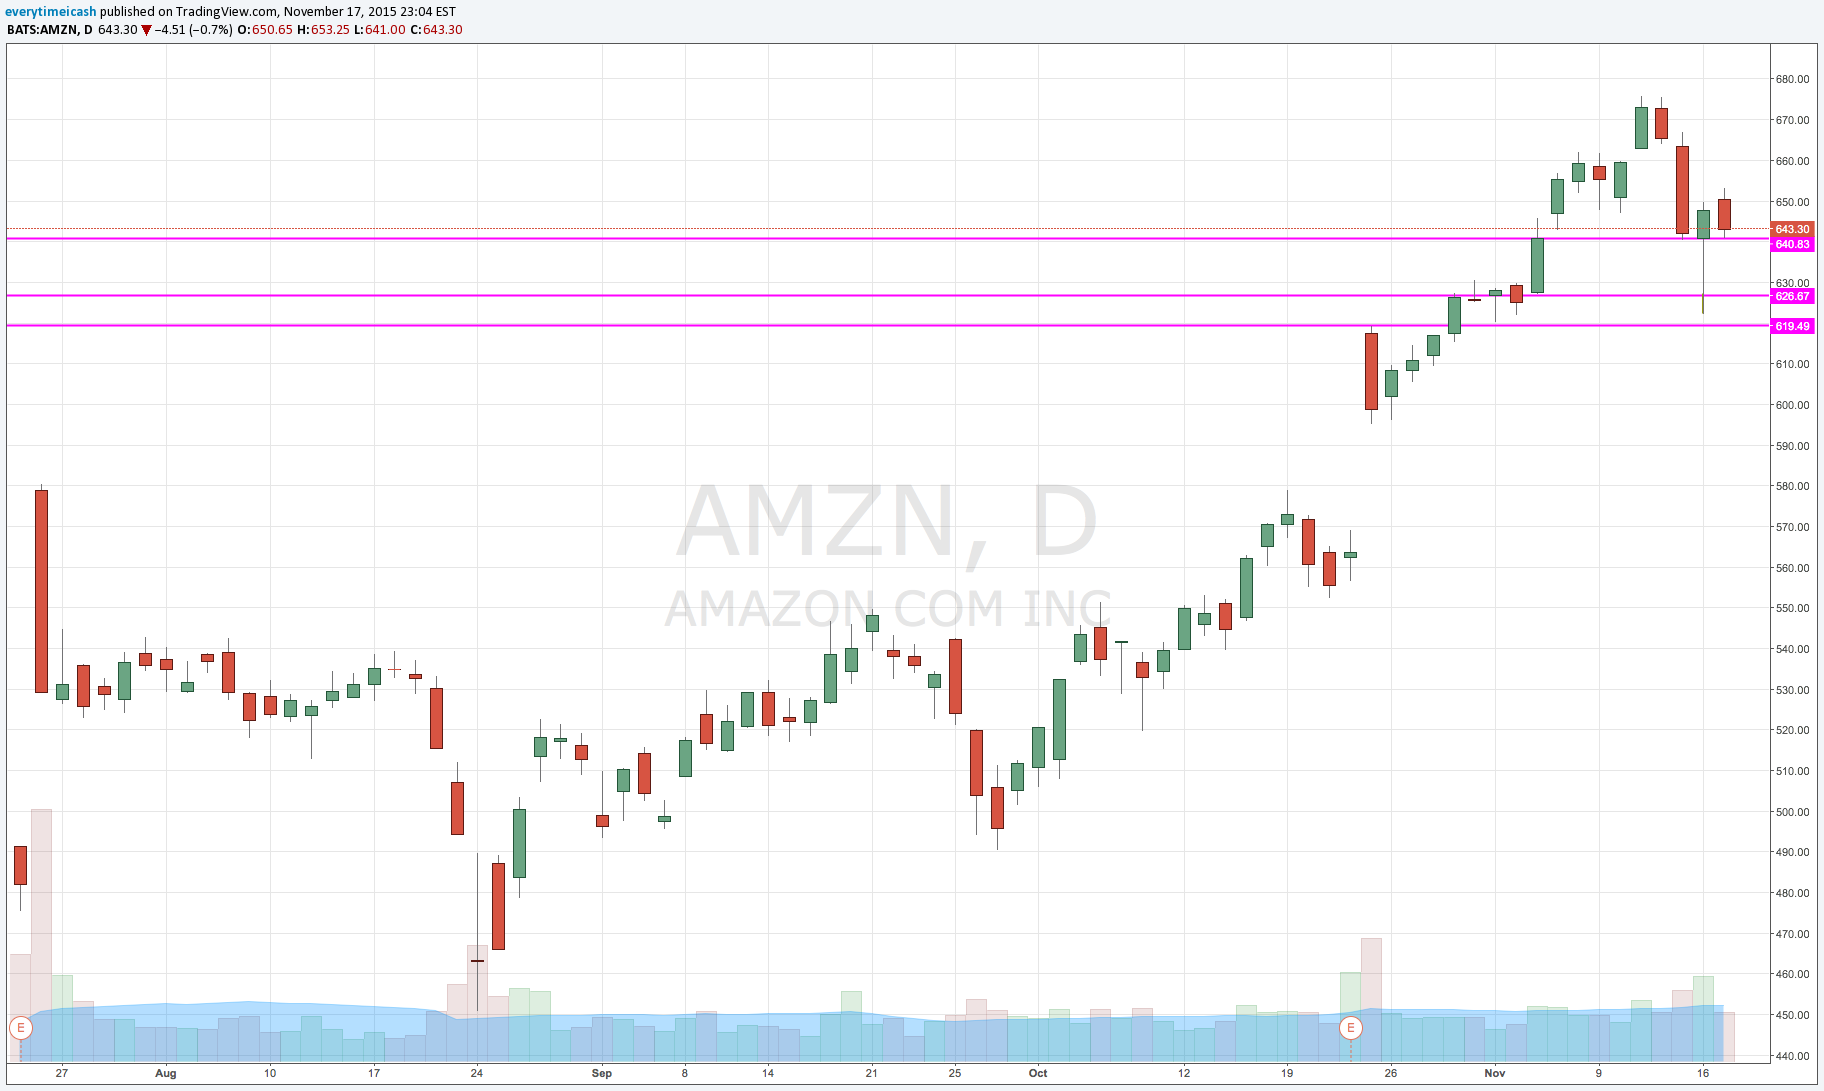
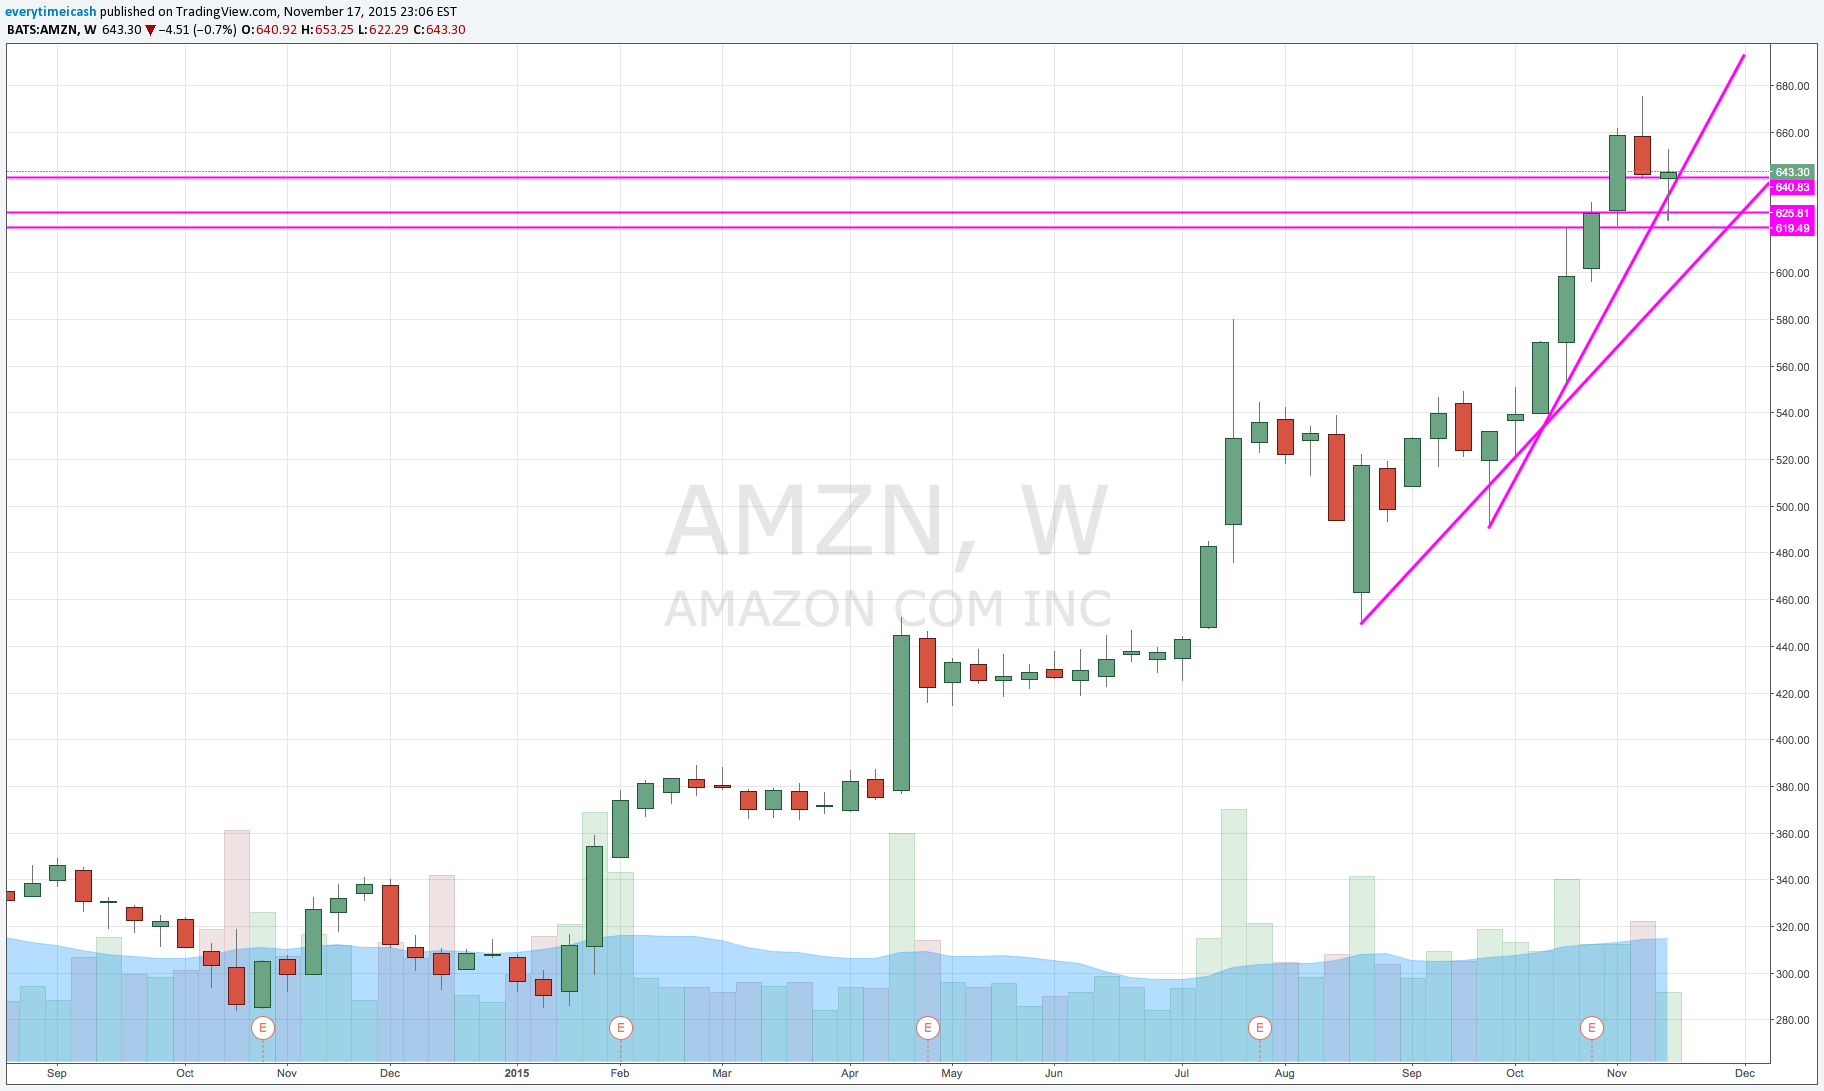
What was once a market leader, AAPL has certainly underperformed its peers this year. With stocks like AMZN NFLX and GOOGL all up substantially YTD it is only fair to wonder what is happening with AAPL (the stock, not the company). Before I dive in a little deeper I want to stress that I am a big fan of the company and believe that they are the most soundly run company that I've ever encountered. I liken Apple as the A student in the class. Eventually, the teacher gets accustomed to that student's stellar results and starts to only make commentary on his/her "poor" (A-) performance. The opposite is also true. There will always be students that are B/C students and when they start to perform up to the B/A level the teacher will be impressed more so than when the A student continues to make his/her marks. Let's focus on this first.

As humans, we're psychologically wired a certain way. Specifically, we like to believe that we are the purveyors of information and that we actually know more than our peers. Ironically however, it takes those same peers for us to get anywhere typically. That's why shit stocks like TWTR continue to find fools as they continue their landslide lower. In order for a market to be made, you need liquidity. In order for liquidity to exist, you need people on opposite sides.

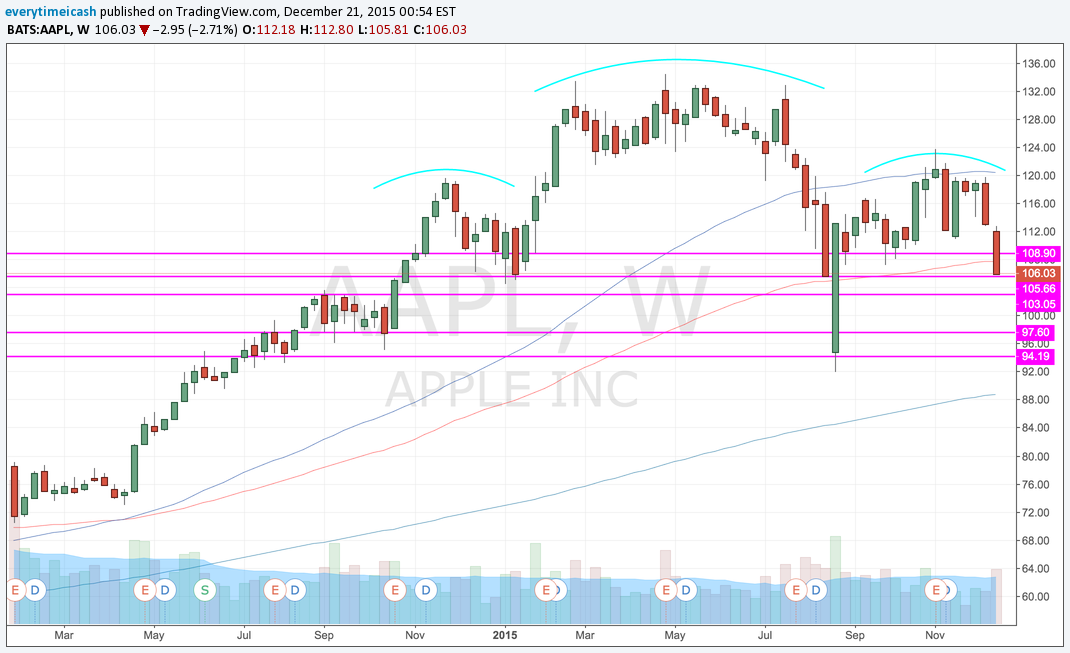
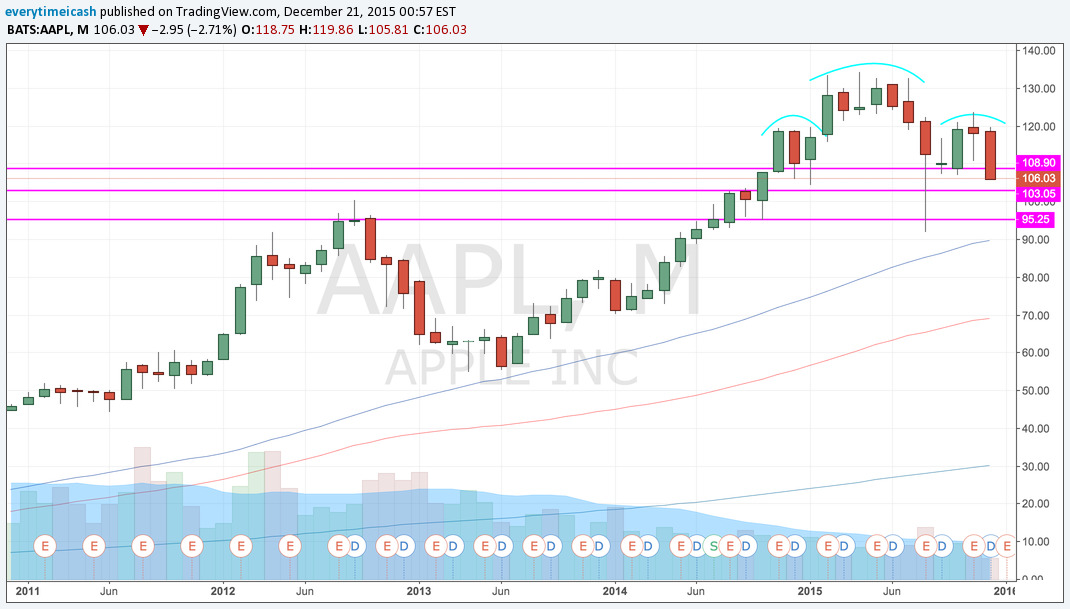
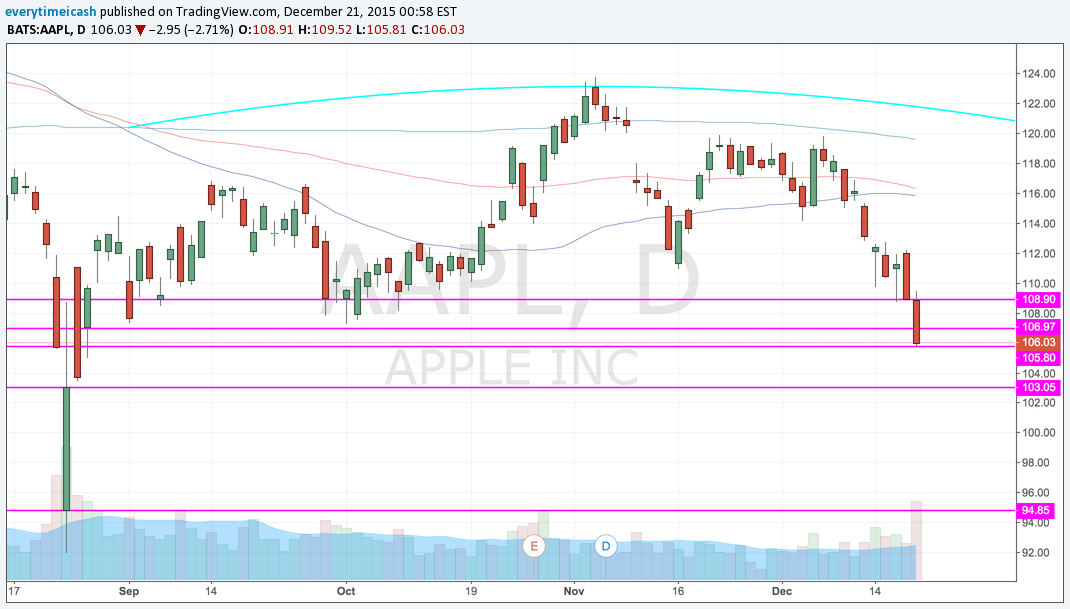
It is very important to distinguish between Apple the company, and AAPL the stock. As I said above, the company is likely the best one we've ever seen and will ever see in our lifetime. Currently however, the stock is not. As highlighted a multiple times and most recently a week ago, the stock is currently and has been trading poorly. It does not matter what time frame you use on a chart, it is tough to find viable support in the issue. That said, that's not the biggest problem the stock may face. I use the word may because this company has been founded on innovation and can turn the corner at any point and regain their innovative ways. We can all speculate what we believe is in their pipeline, or what cutting a particular supplier may do, but at the end of the day we simply do not know. 


GETTING "OVER"


Aside from poor performance and relative weakness to its peers, AAPL has another hurdle it may have to overcome. Up until now, the stock is still endeared in the eyes of Wall St. analysts. With 47 Buy ratings, 7 Holds, and 1 Sell, the stock is still heralded. Though this works in the favor of the company currently, it may end up "taking a bite" out of the stock in the future (if things precipitate to the downside).

Let me put that statement in basic terms for you. Currently, basically everyone and their fucking brother is positive on AAPL, and the stock still can't seem to perform. What happens when people who have been bullish all of a sudden get tired of the bull case and switch their tune? If the stock is not performing by then, it will likely start to really crumble. 


Click the "Join Now" button below to sign up for private content and real time actionable alerts.


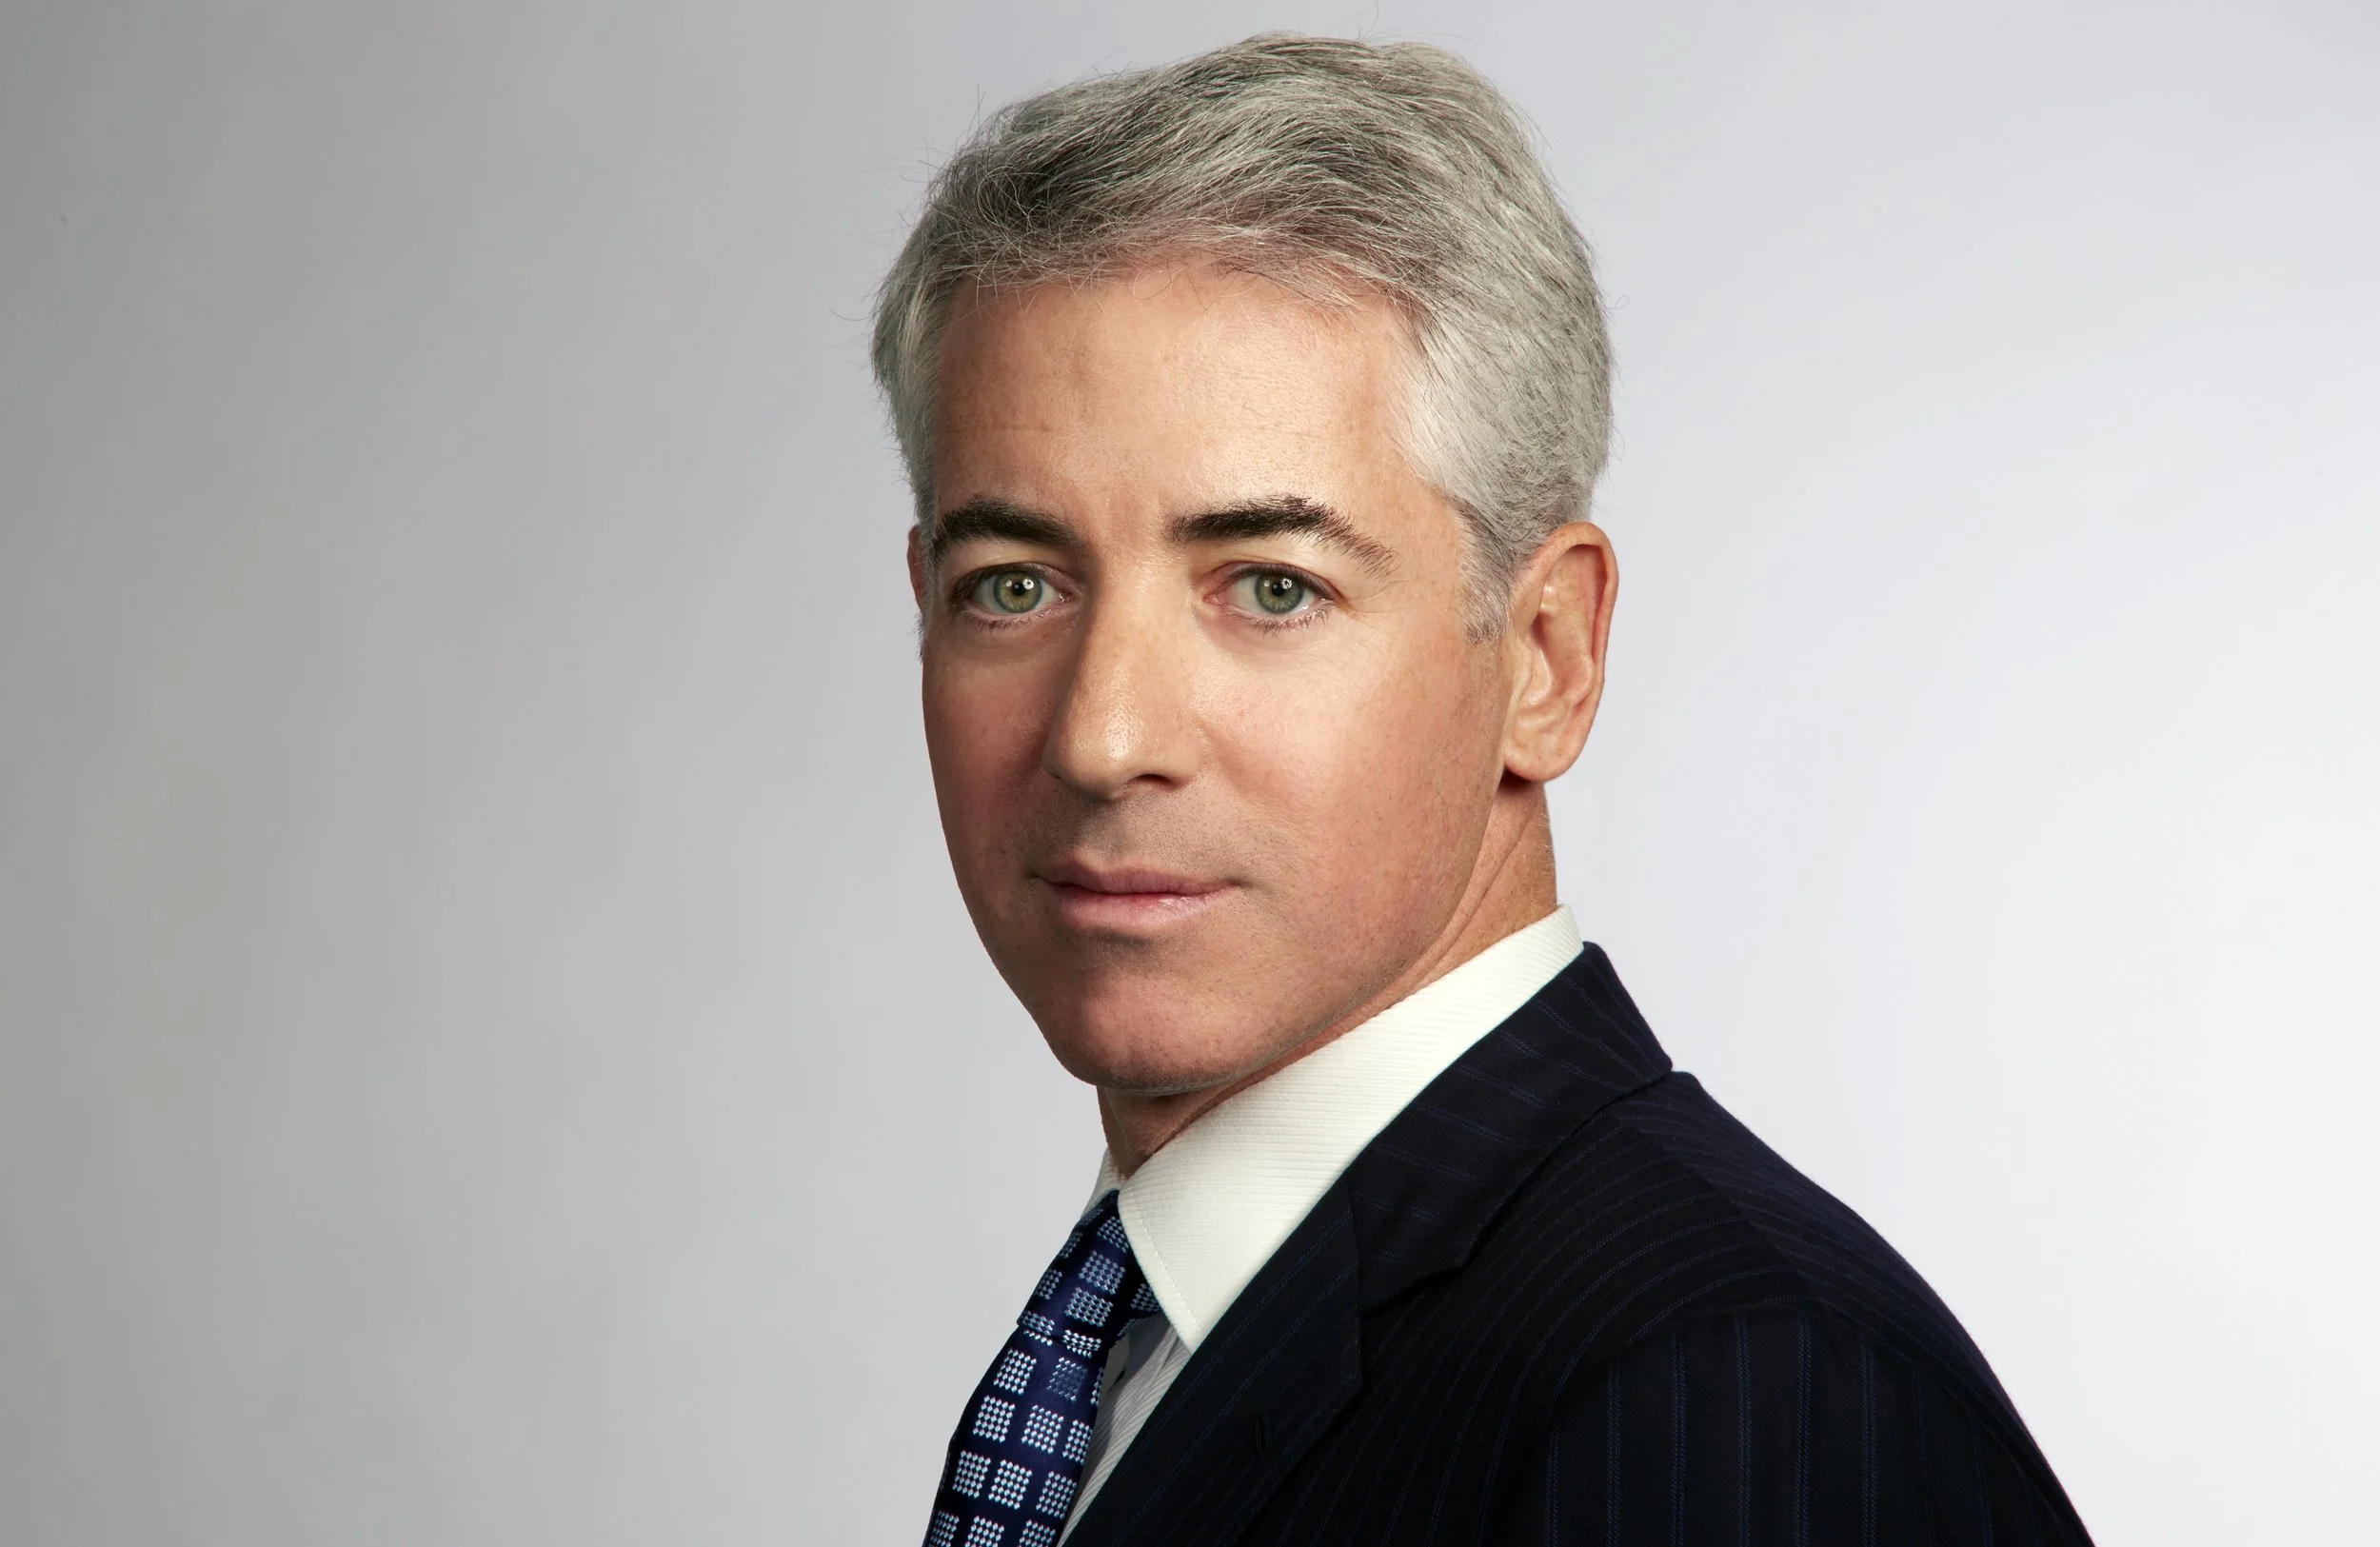
Another past positive and potential clusterfuck for them is the ownership stake by Carl Icahn. Upon announcement of the stock purchase, the stock rallied, and rallied hard to eventual all time highs. Icahn indicated that this purchase was again a "no brainer" like his NFLX transaction. Though this may be the case, the stock's performance has not been that way. So it will be interesting to see where he goes with this trade moving forward given quickly rising poor market sentiment. 


THE SKINNY


At this point many speculate that part of the problem with how AAPL has been behaving/performing is in part due to their potential that this will in fact be the first holiday quarter in which the company does not see iPhone sales increases. Put another way, this will be the first time (allegedly) where the company sees a slowdown in iPhone sales year over year (COMPS). 

That said, the stock is still cheap. Trading at <10x EPS. At this point it really depends on what type of investor/trader you are. If you are of the speculative variety and look for quick hitters, this is probably not the stock for you. If you are looking for value and for potential long term growth, this could soon provide you with the "no brainer" opportunity many see/saw in the stock. In my eyes, the stock is currently a "no touch" until it proves the 105/103 support zones are for real or clears 122. 

As always, if you found any of this useful please share. Cheers!


JOIN NOW

For real time actionable trade alerts and private site content.


1 Comment

Threading the Needle

Comment

Threading the Needle

It is not good to be too curious about all the reasons behind price movements.
— Jesse Livermore

Like many, I spent a part of my weekend keeping tabs on what was going on in Paris. I tried my best to avoid 3rd part media outlets and tried to stick to raw data from a Reddit thread a friend of mine passed on to me. Going into Friday my bias was to the downside and with relentless selling pressure and support broken on Friday in SPX I saw no reason for that downside pressure to cease. 

So with the news of a terror attack shortly after the market closed on Friday it was no surprise that stock futures accelerated their declines. And when they closed for the remainder of the weekend at 8pm on Friday, the markets were hinged on just how bad the news would be from Paris. Two days of pins and needles. When they finally reopened Sunday night those wanted to panic did. And with that sudden and slight panic we tested the 2000 support level on SPX and found support there. Monday's session followed this lead and the markets continued in uptrend fashion "business as usual." 

Personally, I am not a fan of trying to find trades that require precise entries. I prefer broader time frame breakouts/breakdowns and find painting with a broader brush to provide the optimal risk reward for success. Monday's tape however provided great opportunity for "bottom fishing." Specifically with AMZN. 

AMZN's stock just came off nearly a 10% decline from its all time high just this past Thursday. The issue was trading off nearly 53 points in just 1.5 sessions. This decline landed the stock near some critical support and gave us an entry opportunity. Again, I am typically the type of trader that finds broad based breakouts and breakdowns on multiple time frames, but could not resist an opportunity like this. I want to quickly assess the psychology of the trade and give a frame of reference to it for future potential finds like it. 

AMZN 4 H.png

If we take a look at both the daily and weekly charts for AMZN we notice that there is support near the 620 level on the issue. Furthermore, if we take a look at the 4 hour chart we see a solid trend line in tact and both support and 50 day support lined up again near 620. With this information, I assessed how the stock would behave on a five minute basis (MOMO) intraday chart. 

AMZN 5 Min.png

As we can clearly see on the five minute chart, the issue found its support around 620 as we'd hoped. Specifically we saw three hammers on the five minute followed by higher lows and higher highs. Though our exact target of 620 was not necessarily tagged, that level was in fact tested and did in fact hold. That presented us with a beautiful combination of an opportunity. 

The following combination is what I'd like to highlight:

-Approximate 10% retrace from ATH in just two sessions 

-Wildly "oversold" conditions both in the market itself and in the issue

-Multiple time frame support alignment

-Multiple hammers against multiple support levels. 

With that said, each one of these indicators alone would present for a good opportunity to the long side. Combined they presented a great combination for a very well defined trade. Moving forward, we are now able to see what sort of potential a trade like this may have. 


Comment

Red Handed Denial

Comment

Red Handed Denial

We want to perceive ourselves as winners, but successful traders are always focusing on their losses.
— Peter Borish

I want to start by saying that even with today's nonsense I walked away from the table with a significantly profitable day. Not Wall Street billionaire or Oprah Winfrey Weight Watchers big, but big nonetheless. 

I have been a trader in some capacity, whether amateur or professional, for over nine years now. In my time I've survived some crazy upswings and some violent turmoil. I've seen companies implode and others sustain astronomical gains. I've watched as CNBC has recycled and churned their fair share of pundits and "hot shots." Like all "viewers" I have my fair share of likes and dislikes, I've ridden the wave of "Fuck you Uncle Carl" to "Holy shit, uncle Carl!", and have watched the totem pole of the "Hot new hedge fund king" get churned. 

With all that said, I've never seen anyone cross the airwaves (including Dan Nathan himself) in such privileged pejorative guile anywhere close to that of William "Bill" Ackman. Aside from his self absorbed attitude where even his billionaire peers hate his guts, I cannot recollect an instance in the last three years plus where that guy has been significantly right on anything. When I pour through his bio, I can't see anything really that screams "Brilliant" when it comes to trading or investing. I guess the MBIA thing maybe, yeah, maybe? 10% stake in Target? Well I guess if you have that kind of cash, yeah sure. The Barnes & Noble deal? Lol, really? That's all you got?

Before I go any further I want to take a moment and show a two graphs. I also want to remind everyone that no one individual is bigger than the tape. No matter what sort of self righteous  Napoleon complex exists with them, they are just minnow in an ocean of whales. 

Bubble Phases

Bubble Phases

These are the well known, repeated, and outlined phases of any stock market bubble and crash. 


VRX


VRX Weekly

If you lay VRX over the phases of a bubble what do you get?

Fucking perfection. 


Dear Bill, you privileged narcissistic asshole, you are fucking wrong. Admit it, move on.

The fun thing about the market is that even when you are right, but not right with the timing, you will go broke before you are actually right. I get it, you grew up in a privileged New York Real Estate family and are accustomed to hanging around people that were not on your level. But Billy, this is like the time where you bet your dad you'll get an 800 on your SAT. Except this time, your dad can't let you off the hook and you're fucking with other people's money. Not just your own. This isn't

Oh and Billy, take it from a guy who actually got a perfect test score and is used to being "The smartest guy in the room" (even with you in it). Doubling down on monopoly money at the tail end of a QE cycle is just lunacy. Especially when shit is broken. You might as well head to vegas "Playar." 

Based on nothing more than your arrogance I hope to God you're wrong and this VRX is Enron 2.0. Just so I can stop hearing about you and your self adoration. 

Aside from all this, I am just unsure how long this will last before people start to investigate if you're running a Ponzi Scheme the likes of which has not been seen since Bernie. Seriously, how is anyone as wrong as often as you are without any severe setbacks? Tick tock Billy, tick tock. 

Currently NO POSITION in VRX.


Comment

Stay Golden

1 Comment

Stay Golden

Everything you need to know is right there in front of you.
— Jesse Livermore

This morning was weird. The market felt heavy and tired. The bulls seemed exhausted and it appeared as though we'd get a late day fade such as the one we had yesterday. Earnings were missing left and right, market leaders were weighing on the market, everything "felt sluggish." I mean, even I called it this morning premarket. "$GS 175-176 support if it closes below that get ready to short it to hell."

Something strange happened this morning though, something different. This was the first time in a while that the market Bulls seemed to sucker the Bears in. As the SPY was fading later morning and our members were saying "Get ready for a fade!" the market internals were telling you something different. Stock heavyweights were not giving up support. AMZN wouldn't relinquish its grip on 547, GS moonshot off the lows, hell, even WMT caught a bid off its 3 year lows. Something was different, and I was letting everyone know "Don't expect the fade at the end of the day." 

With the potential for a lack of tightening and possibility of another round of some form of easing, today's tape basically told the bears "Fuck you." The bulls which have been waiting for months for the floor to fall out underneath them decided to take a stand. They decided, for whatever reason, that today would be the day they put the onus on the bears and dare them to move. If you're a bear, this isn't good news. 

This is the part of the year where things really start to ramp seasonally. I don't know if it's the cold air, the PSL mania, or all the scarecrows but something about the middle of October on usually gets things going. So with that said, we turned from Heel to Face and sometime around 12pm we went very very long. 


GO WITH THE FLOW


I have news for you, the market is in fact rigged. There is no doubt about it, the big boys are in control of it and there is nothing you can do about it. That said, we have advantages that the big boys never have. We have the ability to switch our opinions on a dime and follow the money. Today was a classic example of that. Staying stubborn and not following the trend will blow you out of the water. But days like today are great for us as well because we can participate and stay in the action without risking much capital upfront. We're gonna take a look at some examples of this. 


GS & FINANCIALS


This morning I highlighted GS support at 175 for members. We highlighted bias to the downside after an earnings miss and kept it on our radar. GS however decided to change the rhetoric and flipped a long off that 175. That flip along with commentary about growing organic loans from other banks sparked a fire in the space. You could have bought calls very cheaply today and walked away very very pleased if you were paying attention. This is just one example of how simply only knowing the support of a stock could help you capitalize even if your bias was initially incorrect. 

GS JPM and XLF 


IBB & BIOTECH


In the premarket the IBB looked like it was going to be the leader to the downside. With a subpoena issued to VRX, a heavy market, and with the IBB at support premarket this one appeared as though it was left for dead. Yet again however, buyers stepped in at support. Claiming 298 and riding it higher throughout the day, buyers continued and reclaimed the bear flag breakdown from the other day. 

Bios up up and away.


F.N.G. AMZN


With NFLX missing ER last night you would think that the other betas would have been hit as well. That however wasn't the case as the beta cohorts really ramped, especially AMZN. 

AMZN gapped higher with the market and appeared it was going to repeat what it went through yesterday where it lagged its internet peers. However, this time AMZN held support at 547 and started its catch up trade higher. 

On the heels of poor #'s from NFLX and a bad revision from WMT buyers stepped in ahead of next weeks report and bid the stock to highs not seen since its last ER and its highest closing high ever. 

Buying was relentless and lasted throughout the day. Expect this issue to resolve even higher before the company announces next week. 

AMZN played "catch up" with its cohorts as it lagged the last couple of days. 


SPY & QQQ


This face tearing rally sets us up for an interesting fourth quarter and moving forward. Specifically, the SPX/SPY closed on the highs of the week and appear to have taken out important resistance and setting up for a test of even higher resist. 

The same can be said about about the triple Q's which have been the strength of the three indices. Let's take a look at the next levels we may test. 

SPY & QQQ Verge of breakout and potential levels. 

With the SPY closing above the 202.2 level that was a brick wall of resistance earlier in the week we are primed to test the next levels of support. Barring a cataclysmic fall tomorrow morning look for this market to test the higher highs soon. Remember, we have the flexibility to switch our opinions and positions more often than the big boys. Because of this ability, we can, and should make money going up and going down. 

CURRENT BIAS: LONG WITH POTENTIAL FOR HIGHER HIGHS

1 Comment

Life "Support" - Part 2 (Bubblicious)

Life "Support" - Part 2 (Bubblicious)

“Men who can both be right and sit tight are uncommon.”
— Jesse Livermore

In the previous post we discussed the first known bubble (Tulipomania). In this post we will assess other more tangible examples that should help you forget the notion of "Now or never" with stocks you want to purchase. 


BUBBLICIOUS


We've all at one point or another tried to blow the biggest bubble we can. We dance that fine line of trying to get it as big as we can without it snapping gum back in our face. The analogy of a bubble is quote symbolic, and in turn, quite perfect. When you're first blowing a bubble it takes quite a bit more effort than it does to actually pop it at the end. That said, there is also an inflection point where it doesn't take much effort to actually make the bubble get bigger. Physics takes over and the volume inside the bubble is optimal for growing it. That is of course until it's not. 

If you recall from the previous installment we talked about the first known bubble, Tulip mania (or Tulipomania). Since it's hard to grasp relative to today's terms let's use stocks and indexes to illustrate what a bubble looks like and what happens when the gum snaps. 


.COM (1995 - 2001) 


Sure many of you have heard of the .com boom/bust but how many of you have actually taken the time to investigate just how big it really was? Fear not, we'll take a look at some of what went down during that era. 

The point to take away from the above is not that there is any prediction about a foredooming situation in the markets. The point is that when markets start to break the accelerant behavior of the market selloff is vastly greater than the rising behavior in an uptrend.

Let's take a look at some individual names from the .com bubble. Most of these companies still exist today. 

Some of these companies eventually recovered (AMZN AAPL) but most do not and never do. 


HOUSING SUB PRIME


Soon after the dot com bubble dust settled we were in the middle of yet another cataclysmic bubble, the housing bubble. In many cases this was significantly worse than the dot com bubble because it impacted many sectors across the board and scarred many investors for years to come. Some of the stocks that were resilient through the .com collapse (namely banks) were absolutely obliterated after the housing crisis. Unlike tech stocks that were a “new paradigm” the housing market was built on the notion that “everyone needed a home” and that homes and investment property in general functioned as a “store of value” which was infinitely “safer” than the bogus paper of the .com stocks. Just like tech stocks however, these stocks and this sector was overplayed by the greed of the investors and facilitated catastrophe in the end.

Take a look at just how big some of these decays where. 

As you can see, most of these names still have not recovered from that beatdown they suffered


POP


So what did we learn? We learned that typically when markets take off things get vertical pretty quickly and they last for multiple years. We also learned that when they break, they fucking break. The breach of trend is typically at least a 50% correction and that correction is much more violent than the uptrend. If the market leader turns out to be the cause of the bubble, that break is typically significantly more than the 50% correction and usually 80% or more is lost. 

That said, we need to remember our rules. We need to stay disciplined when things break trend and learn to get out when our stops are blown. Even though we don't need anymore reminders, let's conclude by going over the basic flow of a bubble. 

I’d like to end this by simply reminding you that this is not a forecast of doom and gloom to come. This is just an explanation to you that history has a funny way of repeating itself over and over again. Whether it’s tulips, railroads, tech stocks, housing or maybe the future cure for AIDS, investors have always and will always overplay their hands causing the majority to be left with the pain in the process.

With that said, the investment vehicles that are left standing at the end of the day have always, and without exception, fucking lasted through capitulation.

Let the games begin.


Life "Support" - Part 1

Life "Support" - Part 1

Markets can remain irrational longer than you can remain solvent.
— John Maynard Keynes

I'd like for you to read the quote at the top of the page and let it soak in. Take a few moments and read it over and over and out loud if you have to so that you can become a believer in that statement. There is no greater cause for money lost than conviction in the wrong direction. This post goes hand in hand with the first post of this thread "Stick to the Plan." 

The purpose of this post is to reassure you that neither I, nor you, nor your mom, nor your best friend, nor Goldman Sachs, nor the Market Maker, nor Warren Fucking Buffett know where the market will ultimately go. We have our charts, our technical analysis, our valuations, and we play the odds but ultimately that is all we are doing -- playing odds in our favor. 

The stock market's prices are strictly an indication of future value based on speculation. As such, the "game" of speculation is determined based on future favor. Simply put, an equity's price is basically what people are willing to pay for it now  based on where think the company's value will go later. That said, how is a stock's price often determined? Let's address this below. 

People often mistake a company's market cap as the value of the company. That is not only wrong, but it will certainly mislead you into believing a company is good/bad depending on its size. A company's market cap is simply the total dollar value of a company's outstanding number of shares. In layman terms, market cap is the total number of shares a company has x the stock price. 

  • Market Cap Example: Company A has 500 shares available for sale at $2.00/share. Company A's Market Cap is $1000.00.


So what's the point? Why does any of this even f'ng matter? 


The point of this is to remind you that when you're wrong (you being everyone, myself included) you need to admit defeat quickly and get out of your false assessment. Markets move irrationally, and when that irrational behavior takes over against you, it will cost you more than you'd typically imagine. I will highlight this irrational behavior below with several examples, some present and some from previous days. To start, I will highlight the craziest one of them all -- the Tulips. 


TULIP0MANIA


For those of you who don't know, Tulip Mania or Tulipomania was a period during the Dutch Golden Age where in 1593 tulips (yes the flower) was brought over to Holland from Turkey. They started off as a novelty and the flower quickly became sought after and ultimately pricey. Fast forward a bit and the flowers contracted a virus called mosaic that didn't kill the flower, but instead changed them causing "flames" of color to appear on the flower petals. This made the flowers more "rare" and "unique" flowers. This ultimately drove the price of the flowers through the roof. The flowers were subsequently priced based on how their virus alterations were valued, or desired. Seriously, people were putting different prices on the same flower because they thought one was more valuable than the other. Soon after, everyone began "dealing in bulbs" and boom a speculative tulip market was created and believed to have no limits. 

Bulb buyers (the garden centers of the past) soon started to fill up inventories for the growing season. This only limited the supply further and increased the demand and "scarcity" of the tulip.


That's when supply and demand took over and irrational exuberance set in.  


Prices started rising so fast and high that people were selling and trading their land, life savings, and their loved ones (joking here... I think) so they can get their hands on more tulips. 

Now if you think I sound like I'm crazy you're right. I sound like I'm fucking nuts. But sadly I'm not, and I'm not making it up either. That really happened. So how high do you think the cost of a tulip bulb went in the 1600's? 

  • $20?

  • $30?

  • $50?

I wish it stopped there. 

Prices moved nearly 20-fold in a month in an already insanely overpriced market. At it's manic peak, an average bulb could be sold for 160-200 Guilders.  


Put into perspective at today's prices, tulip bulbs (even the bad ones) sold between $48,000 and $64,000.


Tulip prices From November 12 1636-May 1 1637.

The point I'd like for you to take away from this is that markets set themselves. Let your positions run as long as you can afford to, respect your stops, and never think you won't have another opportunity like this again. It takes two sides to make a market and in doing so the market is always binary and always wins. Secondarily, whether it’s tulip bulbs, houses, .com stocks, crypto assets, or any other future novelty that will come; this shit is nothing new. It is all the same. The intrinsic value of whatever asset you hold is determined based on the scarcity of the supply and the perceived value at any given time. With any asset or store of monetary value there is always an inflection point where the risk paradigm skews in favor of releasing the “asset” and returning to “cash.” Cash here is in quotation marks to account for the different permutations of “cash” that have existed and will exist throughout time.

In the next post we'll cover the previous story using other, more practical, examples.