Viewing entries in
Stock Market

Bank of America Earnings Report ($BAC)

Bank of America Earnings Report ($BAC)

The market will be paying close attention to several reports from the banking industry on Friday morning. The two "most important" being Bank of America and JP Morgan.

All Charged Up

All Charged Up

THIS IS MY FAVORITE STOCK OF 2017. WE HAVE ALREADY MADE 400% RETURN ON OUR POSITION IN JUST THREE WEEKS.


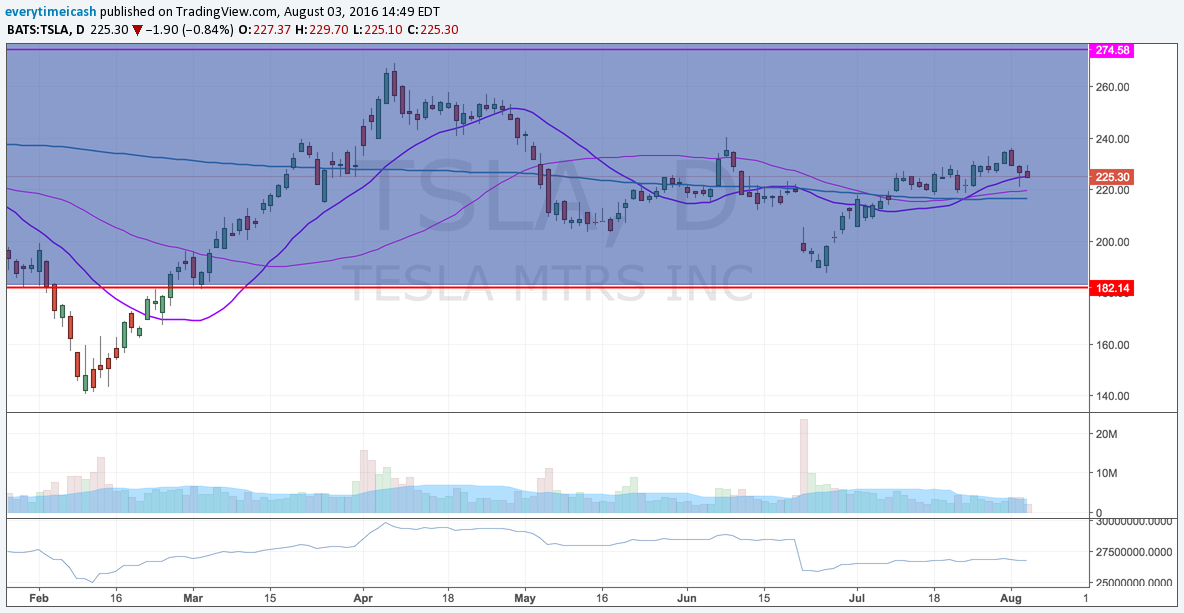
To me there are fewer setups that look as appetizing as Tesla this year. The stock has been lashed out at by bears for two years and has seemingly had everything thrown at it. With that, and barring a completely overall bear meltdown, I find it hard for the investors in the stock to ring the register this year.

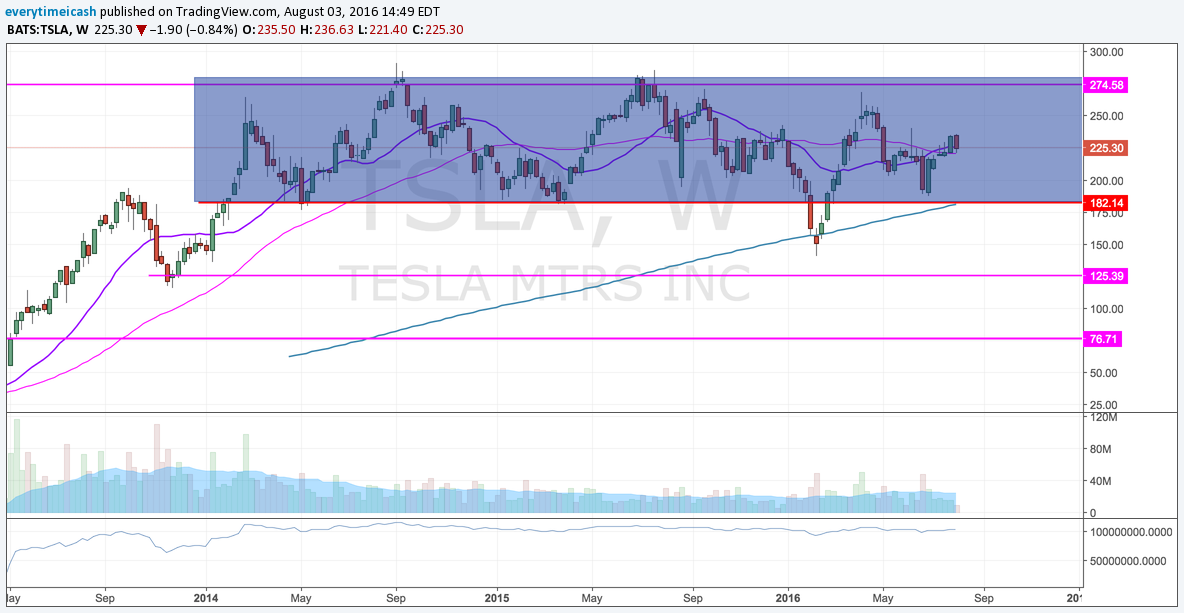
TSLA has been consolidating on a monthly basis.

With the slated Model 3 deliveries, 2017 marks the year that the Tesla mass consumer comes online. With that comes a new revenue stream and the growth dynamic back into play.

The automaker took 400,000 pre-orders for the Model 3 within weeks of revealing the prototype. The main issue they face is producing millions of them, on time, up to quality standards, and most importantly; without losing money. Tesla doubled their production in 2016 to 100,000 cars. In April, Musk said he wants to produce half a million cars by 2020. One month later, he said they’d get there by 2018. Aggressive as that may be, Musk seems to deliver under pressure. The Model 3’s biggest hinderance on performance deliveries are projections, expectations, and supply chain. With expectations coming as a result of projections, supply chain will be your tell with the company’s ability to deliver results.

Competition:

Many analysts who bash Tesla’s stock will have you know that there is a steady increase in competition in recent years. They’re full of shit. Tesla operates in the high end electric vehicle market. Until now, they’ve been the only real player. Recently Fisker, Farady Future , and Lucid Motors have perked up to compete but until now there really hasn’t been a viable competitor.

The main difference however is that Tesla has centered itself on building a network and working outward. SImilar to the Apple vs everybody model, Tesla has open sourced its technology and focused its attention on building a sustainable network/brand first then focus on its product offerings. That’s why the term “Cult Stock” has often been used to describe the company/stock.

Now What?:

As I’ve said above, Tesla has been range bound for nearly two years now. In early 2015, the stock broke it’s 180 “support” level and found itself bouncing sharply off of its 200 week MA. Since then the stock made a high at nearly 270 and then a failure and hold of the 180 level yet again. As of late the stock has once again broken out of its downtrend and appears to be acting constructively. With the addition of Elon Musk to the Trump Advisory team, the short interest, new product offering, and constructive behavior, this stock is set to rip in 2017.

One key amendment to this argument is the price of oil. Which since the Barron’s $20 oil cover, has been constructive and working its way higher. All of these instances bode well for Tesla which I believe has a very defined stop ($180) and a potential to break out to an all time high.

ONE LAST POINT:

TSLA’s gigafactory goes active in 2017 making them the largest battery operator/manufacturer in the world. This will provide countless jobs as well as margin expansion. This will likely bode well for TSLA moving forward with the Trump Administration and as such bears are going to get squeezed.

The $TSLA Play:

To play this stock’s potential, I’ll be putting on a leaped call spread (bullish risk reversal) with the Jan 2019 350 C being bought and the Jan 19 100 P being sold. (You can also buy a lower put strike to hedge your downside risk as well.) This prices that Tesla will see a 50% gain in the next two years which “sounds crazy” but isn’t anywhere near crazy given this stock’s price action/ability. At the time of writing, this position cost a net debit of ~$2.2. 


To see more trades like this one, and for a full 2017 road map preview please check out my 2017 roadmap in the trade reports section on my site. Or click here to purchase: http://www.everytimeicash.com/digitalcontent/2017-stock-market-road-map

It's in the Game ($EA Earnings)

It's in the Game ($EA Earnings)

Electronic Arts (EA) is set to report Q2 results after the bell (released results last quarter at 4:00pm ET). The co has a conference call scheduled to follow at 5:00pm ET. Cap IQ Consensus estimates Q2 EPS of $0.43 (vs. $0.65 in 2Q15) w/revs of $1.09 bln (-4.8% y/y). 

Guidance

Q2

  • GAAP net revenue is expected to be approximately $915 million.
  • GAAP net loss is expected to be approximately ($51) million.
  • GAAP loss per share is expected to be approximately ($0.17).

FY17

  • Ending March 31, 2017 GAAP net revenue is expected to be approximately $4.750 billion (Reaffirm).
  • GAAP net income is expected to be approximately $809 million.
  • GAAP diluted earnings per share is expected to be approximately $2.56 (Prior guidance was $2.53)

Options Activity

  • Based on EA options, the current implied volatility stands at ~ 39%, which is 95% higher than historical volatility (over the past 30 days). Based on the EA Weekly Nov04 $77 straddle, the options market is currently pricing in a move of ~7% in either direction by weekly expiration (Friday).

TECHS:

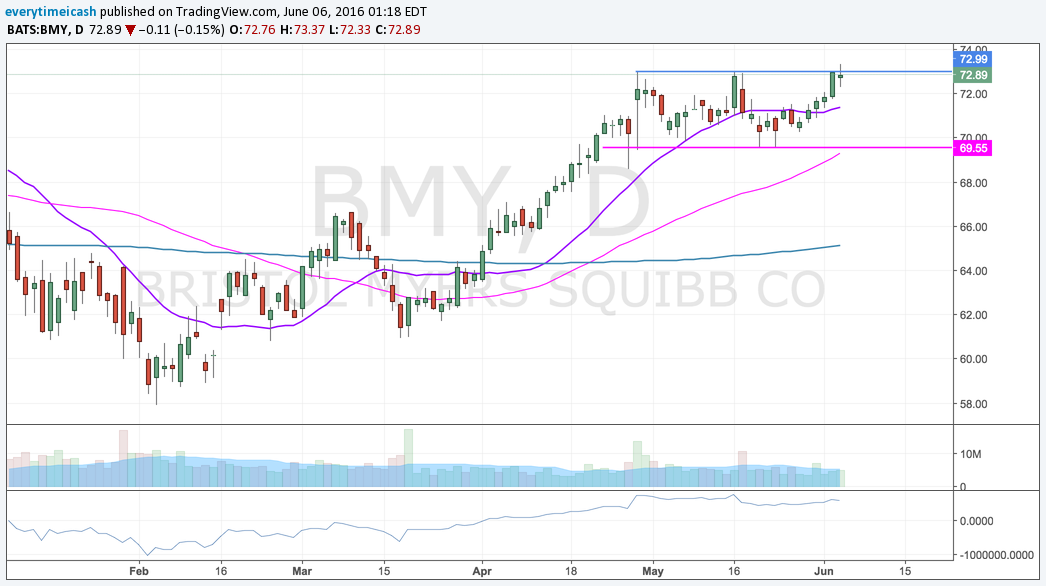
Last week's downgrade took the wind out of the stock. Sellers responded with an aggressive drop below its rising 50-day moving average which has price in "no-man's land" ahead of earnings. Next key support is the 200-day simple ma near 73.

Alphabetical ($GOOGL Earnings)

Alphabetical ($GOOGL Earnings)

Alphabet (GOOGL, GOOG) is set to report Q3 earnings tonight after the close with a conference call to follow at 4:30pm ET. GOOGL reported Q2 results at 4:01pm, the company does not guide. 

Current Capital IQ consensus stands at EPS of $8.60 on Revenue of $22.03 bln.

Shares of GOOGL hit an all time high of $838.50 on Monday but we have seen some profit taking ahead of tonight's report as the stock has pulled back to $820. The company is coming of an impressive Q2 in which it was able to accelerate revenue growth to over 20% for the first time in three years.

The growth was driven by Google website revenues as strength in the mobile and YouTube segments provided a boost. The rise in mobile has also boosted the growth in partners and website TAC which will be an area to watch.

The all time high will certainly be in play, especially when one views the Forward P/E of 20.5x being reasonable for a co that is posting 20%+ revenue increases despite being a $20+ bln a quarter company, no easy feat. A miss by GOOGL should prove interesting with the $783.50 Post-Q2 results being a key level of support. A break of this will send the shares to the $760 with the 200-sm ($757.29) in play.

Key Metrics

  • Revenue Growth
  • Operating Margins
  • Aggregate Paid Clicks-  Q3 expected to increase approx 26% y/y; Q2 +29%;-Q1 +29%;Q4 +31%; Q3 +23%.
    • Paid Clicks on Google websites- Q2 +37%;Q1 +38%; Q4 +40%; Q3 +35%.
    • Paid clicks on member sites- Q2 0%;Q1 +2%; Q4 +2%; Q3 -5%.
  • Aggregate cost per click- Q3 is expected to decline approx 5% y/y; Q2 -7%; Q1 -9%; Q4 -13%; Q3 -11%
    • CPC on Google sites- Q2 -9%; Q1 -12%; Q4 -16%; Q3 -16%.
    • CPC on member sites- Q1 -8%; -8%; Q4 -8%; Q3 -4%.
    • If curious: Cost-per-click is defined as click-driven revenue divided by our total number of paid clicks and represents the average cost we charge advertisers for each engagement by users.

Q2 Recap

GOOGL reported Q2 (Jun) earnings of $8.42 per share, $0.38 better than the Capital IQ Consensus of $8.04. Revenues rose 21.3% year/year to $21.5 bln vs the $20.77 bln Capital IQ Consensus.

RESULTS

GOOGL/GOOG beats by $0.46, beats on revs  

  • Reports Q3 (Sep) earnings of $9.06 per share, $0.46 better than the Capital IQ Consensus of $8.60; revenues rose 20.2% year/year to $22.45 bln vs the $22.04 bln Capital IQ Consensus.
  • Non-GAAP Operating Margin 34% compared to 33% prior year
  • Other Bets revenue $197 mln compared to $141 mln in prior year
    • Other Bets operating loss ($865) mln compared ot ($980)mln in prior year
  • Cost of revenues as %- 39% compared to 38% in prior year
  • Google Website Revenue Growth 23%
  • Google Network Members Websites 1%
  • Google Other Revenues 39%
  • Google segment Revenues 20%
  • TAC as a % of revenue 21% compared to 21% in the prior year
  • Aggregate Paid Clicks-
    • Q3 +33%, expected to increase approx 26% y/y; Q2 +29%;-Q1 +29%;Q4 +31%; Q3 +23%.
    • Paid Clicks on Google websites- Q3 +42%; Q2 +37%;Q1 +38%; Q4 +40%; Q3 +35%.
    • Paid clicks on member sites- Q3 +1%; Q2 0%;Q1 +2%; Q4 +2%; Q3 -5%.
  • Aggregate cost per click-
    • Q3 -11%, expected to decline approx 5% y/y; Q2 -7%; Q1 -9%; Q4 -13%; Q3 -11%
    • CPC on Google sites- Q3 -13%; Q2 -9%; Q1 -12%; Q4 -16%; Q3 -16%.
    • CPC on member sites- Q3 -14%; Q1 -8%; -8%; Q4 -8%; Q3 -4%.

Mouse Ears ($DIS Earnings)

Mouse Ears ($DIS Earnings)

Analysts have a consensus EPS estimate of $1.61 for the third quarter, which was $0.01 higher than their predictions of $1.60 90 days ago. Disney will report its third quarter results after the market closes.


    More Stars ($YELP Earnings)

    More Stars ($YELP Earnings)

    The consensus estimates calling for a net loss of $0.07 per share on $169.82 million in revenue for the quarter. Yelp posted a net loss of $0.02 per share on revenue of $133.91 million in the same period of last year.


    Electric Overdrive ($TSLA Earnings)

    Electric Overdrive ($TSLA Earnings)

    Tesla (TSLA) will report Q2 results in shareholder letter on its website after the bell and host a call at 17:30.

    Tesla is expected to report Q2 non-GAP EPS of ($0.65) vs. ($0.48) last year with non-GAAP rev up 38% to $1.65 bln.

    • Tesla delivered 14,370 vehicles during Q2 vs. 17,000 guidance. Production came in 18,345 vehicles vs. 20,000 guidance.
    • Tesla said it will produce and deliver 50,000 vehicles in the second half of the year, which effectively lowered 2016 delivery guidance to just under 80K (79.2K) from 80-90K previously.
      • Prior FY16 guidance also called for 30% non-GAAP Model S gross margin and 25% Model X non-GAAP gross margin by year end, cap-ex $2.25 bln and non-GAAP op-ex +20-25%.         


    Tesla has consistently missed production and delivery targets.

    • Still, Tesla investors look at the big picture as demand for its electric vehicles remains strong.
    • There is a great deal of skepticism that Tesla will hit its increased (and seemingly impossible) production plan: 500K Model S, X & 3 vehicles by 2018.
    • July 26: Mobileye (MBLY) announces its relationship with Tesla won't go beyond its current EyeQ3 chip. 


    The stock has been very resilient despite added risks as investors give Elon Musk the benefit of the doubt.


    Click here to listen to my podcast and learn about my theory on the similarities between relationships and the stock market

    Nice Tan ($FSLR Earnings)

    Nice Tan ($FSLR Earnings)

    First Solar (FSLR) is set to report earnings tonight after the close with a conference call to follow at 4:30pm ET. FSLR reports at 4:05pm.

    Current Capital IQ consensus stands at EPS of $0.55 on Revenues of $862 mln.

    The FSLR revenue recognition model makes it extremely difficult for analysts to provide accurate quarterly estimates.  The company has been able to handily beat EPS expectations by an average of $1.03. Revenue has been a little less friendly with two big misses and three big beats over the past five quarters.

    The annual projections remain the primary focus for the underlying health of the company and that is where we will be looking to judge the overall performance and outlook. Shares of FSLR have had a difficult 2016. The stock got out of the gates strong hitting a two year high of $74.29 on March 18. But the shares have tumbled 33% since that high water mark.

    2016 Guidance

    • Net Sales $3.8-4.0 bln was reaffirmed in Q1
    • Gross Margin 18-19% (Prior 17-18%)
    • Operating Expenses $380-400 mln (Reaffirmed)
    • Operating Income $300-370 mln (Prior $260-330 mln)
    • EPS $4.10-4.50 (Prior $4.00-4.50)
    • Net Cash Balance $1.9-2.2 bln (Reaffirmed)
    • Operating Cash Flow $500-700 mln (Prior $400-600 mln)
    • CapEx $300-400 mln (Reaffirmed)
    • Shipments 2.9-3.0 GW (Reaffirmed)

    TECHS:


    Click here to listen to my podcast and learn about my theory on the similarities between relationships and the stock market

    Primed ($AMZN Earnings Preview)

    Primed ($AMZN Earnings Preview)

    Current Quarter Expectations: As usual, operating income and revenues estimates are near the upper end of AMZN's prior guidance. 

    Alphabetical Order ($GOOGL $GOOG Earnings Preview)

    Alphabetical Order ($GOOGL $GOOG Earnings Preview)

    Alphabet (GOOG, GOOGL) is set to report Q2 results tonight after the close with a conference call to follow at 4:30pm ET. 

    Current Capital IQ consensus stands at EPS of $8.04 on Revenue of $20.77 bln.

    • Q1 GOOGL saw one of the top and bottom line misses (GOOGL does not guide) but the strength of its core business remained evident and a pick up in revenue at some of its 'Other' business units was encouraging for investors. Growth trends remain positive in mobile search, YouTube, and programmatic which should help drive results. Investors would like to see GOOGL produce a beat similar to FB.
    • The stock has been trying to break out ahead of the report as expectations are high. GOOGL will need to meet these expectations in order to rally back to the $800 level for the first time since February.
    • With regards to FB it should be noted that GOOGL's forward P/E stand at 19.3x compared to 25.2x for FB. As arguably the two best tech companies on the planet at the moment these valuations will be watched closely

    Key Things to Watch

    • Revenue Growth
    • Operating Margins
    • Aggregate Paid Clicks- Q1 was down 3% q/q and up 29% y/y; Q4 increased 22% on Google Sites.
    • Q4 Aggregate Cost-Per-Click- 
    • U.K. Exposure

    TECHS:


    Click here to listen to my podcast and learn about my theory on the similarities between relationships and the stock market.


    Like Me ($FB)

    Like Me ($FB)

    Facebook (FB) is set to report Q2 results tonight after the close with a conference call to follow at 5pm ET. 

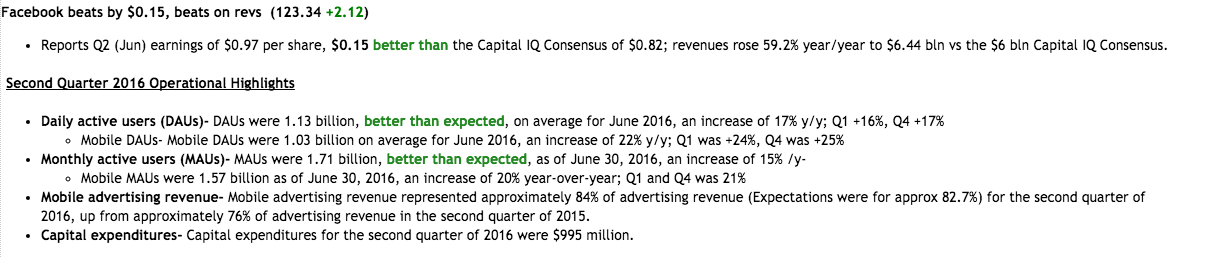
    Current Capital IQ consensus stands at EPS of $0.82 on Revenue of $6.00 bln.

    • Revenue Growth- Q1 revenue growth was 51.8%; Q4 saw revenue accelerate to 52% compared to 40% in Q3 and 39% in Q2.
    • Advertising Revenue- Q1 increased 57% y/y to $5.2 bln; Q4 came in at $5.637 bln which was also up 57% y/y.
      • Mobile Advertising Revenue- Mobile advertising revenue represented approximately 82% of revenue in Q1 compared to 80% in Q4. This is expected to see a small uptick.

    Q1 Recap

    • FB reported Q1 (Mar) earnings of $0.77 per share, $0.15 better than the Capital IQ Consensus of $0.62; revenues rose 51.8% year/year to $5.38 bln vs the $5.26 bln Capital IQ Consensus.
      • See key metrics above.
    • FB also announced its proposal of a new class of stock so look for some updates on this on the call.
    • Why it's important
      • Ad spending drives Facebook's top line, accounting for 97% of the company's revenue in the first quarter.  Facebook, therefore, is watched closely as a barometer for how advertisers are spending and where they are allocating their advertising budgets.
      • Facebook is a leadership stock for the Nasdaq and Nasdaq 100
      • The company and its stock serve as guides for the enthusiasm surrounding the growth of social media
         
    • What Facebook said after its first quarter earnings report in April
      • Daily active users (DAUs) were 1.09 billion on average for March 2016 (+16% year-over-year); mobile DAUs were 989 million on average for March 2016 (+24% year-over-year)
      • Monthly active users (MAUs) were 1.65 billion as of March 31, 2016 (+15% year-over-year); mobile MAUs were 1.51 billion (+21% year-over-year)
      • The average price per ad increased 5% in the first quarter while total ad impressions increased 50% (strong growth in mobile ad impressions)
      • Will face tougher comparisons in 2016 given the acceleration of ad growth in 2015
      • Guidance
        • Non-GAAP expense growth of ~45-55% year-over-year
        • Amortization will be $700 million to $800 million
        • Stock-based compensation to be $1.1 billion to $1.3 billion in 2016
        • Sees capex at the high end of $4.0 billion to $4.5 billion range previously provided
        • Second quarter and FY16 tax rates should be similar to first quarter
           
    • Other Stocks to Watch
       
      • FB
      • Alphabet (GOOG/GOOGL)
      • LinkedIn (LNKD)
      • Yelp (YELP)
      • PowerShares QQQ Trust (QQQ)
      • Global X Social Media Index ETF (SOCL)
        • FB is third largest holding at 9.37% of assets
      • S&P futures

    Click here to listen to my podcast and learn about my theory on the similarities between relationships and the stock market.


    RESULTS:


    Return of the Mac ($AAPL Earnings Preview)

    Return of the Mac ($AAPL Earnings Preview)

    Q3 Capital IQ consensus calls for EPS of $1.39 (versus $1.85 last year) on revenue of $42.126 bln (-27% YoY). The current consensus is near the mid-point of the company's guidance of $41-43 bln.

    Can You Hear Me Now?

    Can You Hear Me Now?

    The current Capital IQ Consensus Estimates call for Q2 EPS of $0.94 and revenues of $3.09 bln. VZ expects full year 2016 adjusted earnings to be comparable to the co's full year 2015 adjusted earnings of $3.99 EPS

    $UA Earnings Preview

    $UA Earnings Preview

    Under Armour (UA) reports Q2 results tomorrow July 26 followed by conference call at 8:30am ET.

    Current consensus is for Q2 EPS of $0.02, operating income of ~$19 mln on revs +28% to $1.00 bln (guided for revenues in high 20s, operating income of ~$17-19 mln and flat gross margin). Since becoming a publicly traded company, UA has never missed earnings estimates.


    Last quarter, Under Armour beat Q1 EPS estimate by $0.02, reported revs in-line, guided Q2 operating income / revenues in-line and slightly raised FY16 guidance / reaffirmed margin guidance.

    Headed into the print: UA has held onto these recent gains and is back near pre-Q1 levels. 

    Based on UA options, the current implied volatility is 14% higher than the historical volatility (over the past 30 days). UA Weekly Jul29 $42.5 straddle is currently pricing in a move of ~8% in either direction by weekly expiration (Friday).

    Key metrics and areas of interest:

    • Current Quarter: Following the decision of the bankruptcy court to approve the liquidation of The Sport Authority's business rather than a restructuring or sale, Under Armour determined to recognize a Q2 impairment charge of ~ $23 mln and updated its Q2 and FY16 outlook. The company reaffirmed Q2 revenue growth in the high 20s but revised operating income to $17-19 mln (prior $40-42 mln) as a result of the impairment.
    • Guidance: The Sport Authority mid-quarter update included revised 2016 guidance for operating income to ~$440 -445 mln (prior +23-24% to $503-507 mln) on net revenues +24% to $4.925 bln (prior +26% to $5.0 bln). Updated outlook will be included in the earnings press release - estimates are tracking slightly ahead of the this prior outlook with operating income of +11% to ~$453 mln estimate and revenues +25% to $4.96 bln.

    Techs:


    Click here to listen to my podcast and learn about my theory on the similarities between relationships and the stock market.


    Homes and Big Macs

    Homes and Big Macs

    Close to 40% of the S&P 500 will report their quarterly results this week. That includes McDonald's, which will report before the open on Tuesday. 

    Brexit Stage Left (6/6/17 Weekly Setups)

    Brexit Stage Left (6/6/17 Weekly Setups)

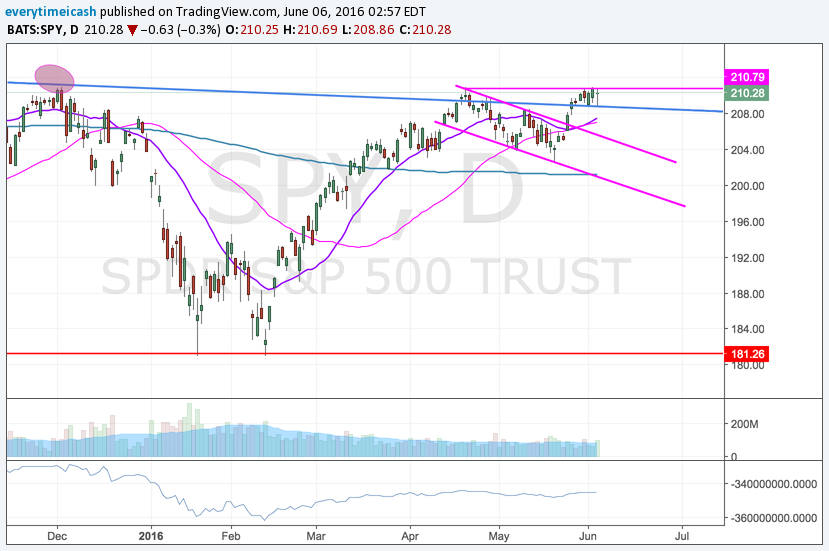
    As I've been telling you guys for months now, the rate increase is not likely to occur in June and most likely to occur in July. My rationale for this has always been two fold: 1) Brexit and 2)A rate hike now is too soon and one in September is too close to the election. Last week's data gave the markets a quick rattle but by the end of it investors and traders had been calmed by the depreciation in likelihood that the Fed would move in June. Well like a kid turning his homework in late, the market seems to be peeking over its shoulder at the Brexit event looming. With that, the market is pricing a lower possibility for a rate hike in June.

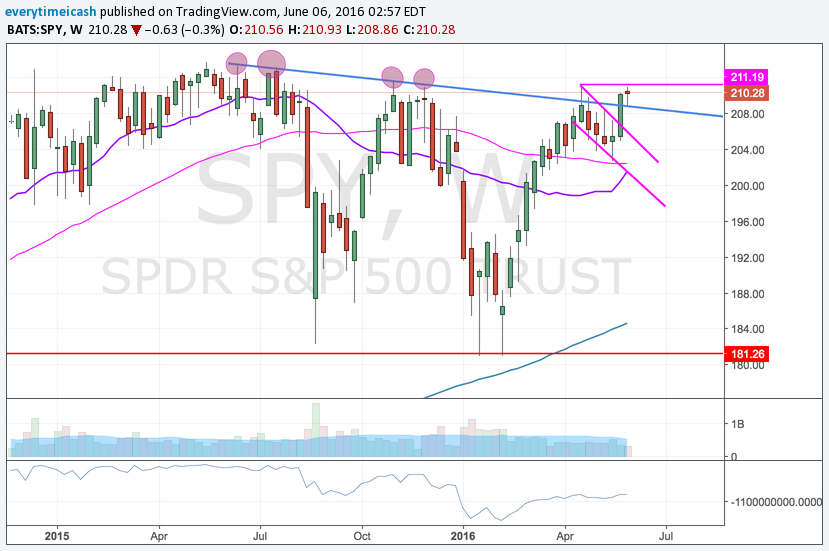
    That said, we are sitting at 2100 with the potential of an all time high breakout in the stock market. My bias is that we will eventually take out the highs, continue to rally and cause capitulation before ultimately falling apart. So for now, the pain trade remains to the upside until a catalyst occurs to "shake things up". With that in mind, I'm focusing primarily on stocks that are poised for higher. Below are the SPY charts to keep an eye out including a FIBS chart for potential resistance.

    AMZN

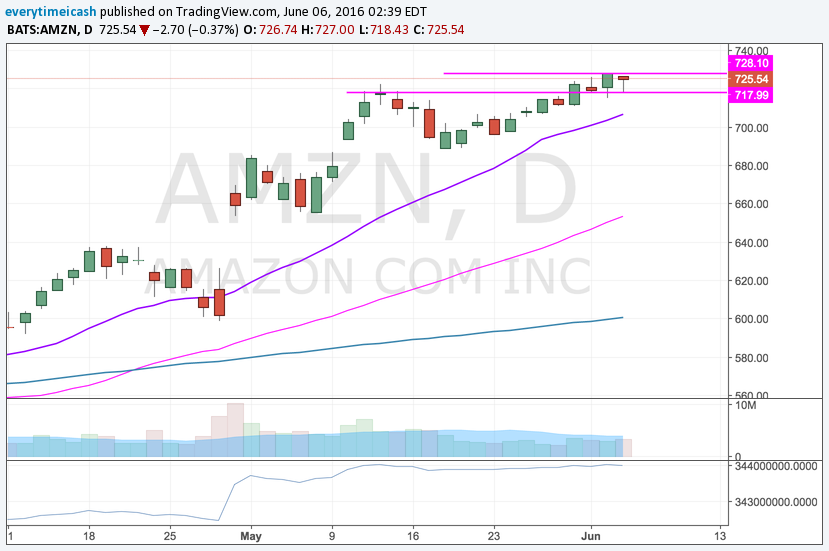
    Winner winner. 717 support. 

    AAPL

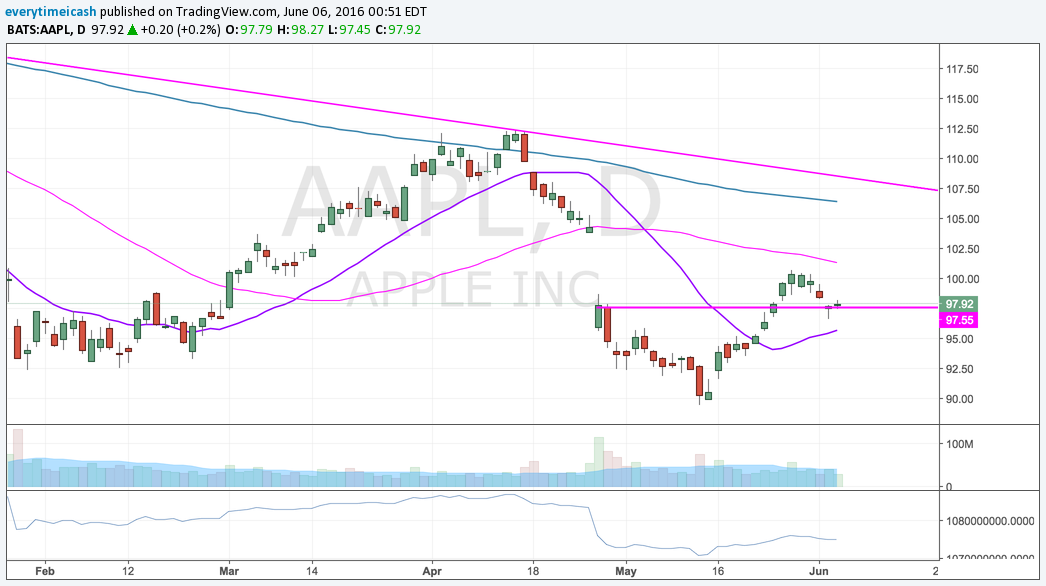
    Could be at support retest, could be a cup and handle, could be a rollover. It all depends on how 97.5 will hold.

    ADBE

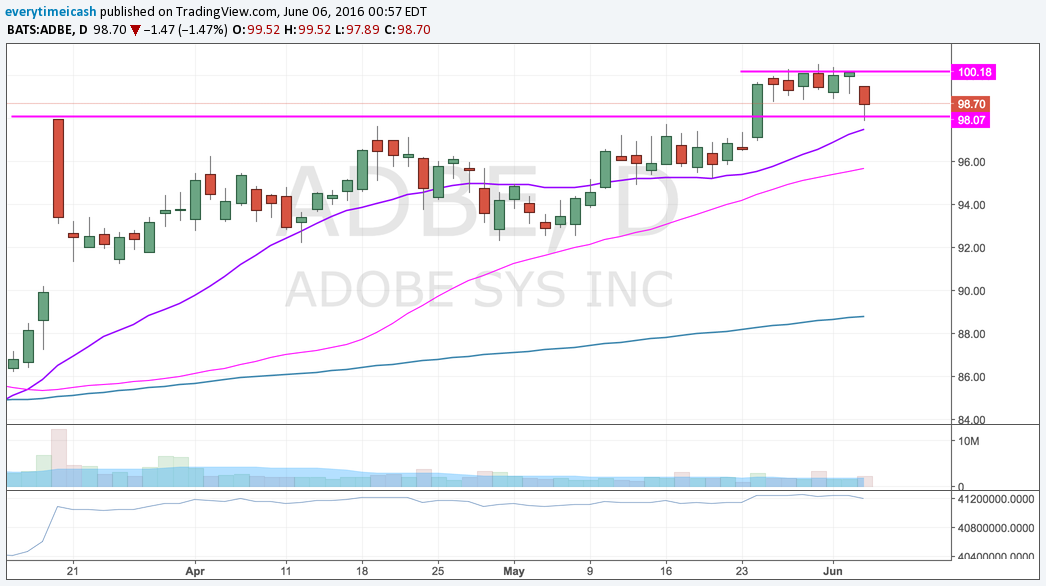
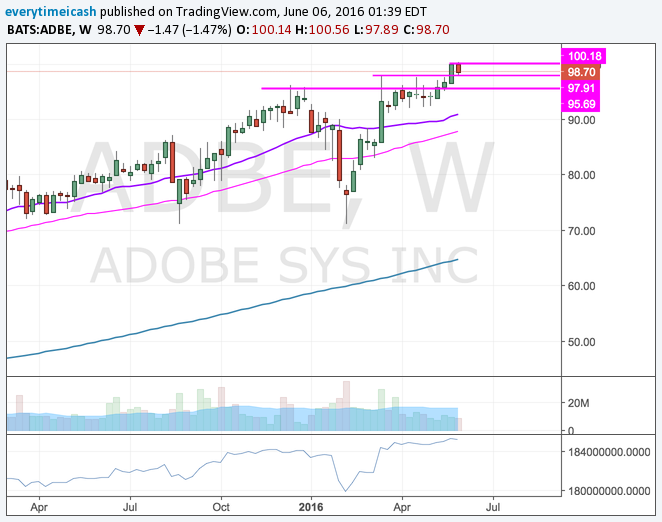
    Support retest held. This should be a long so long as this holds. Rising MA's should push this higher moving forward. 100.30 is the breakout.

    AMBA

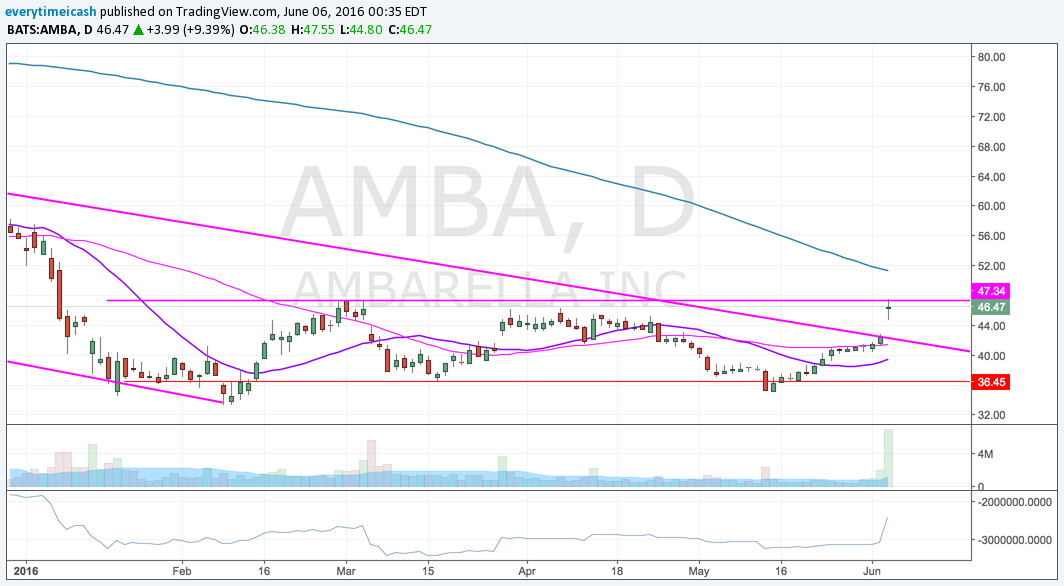
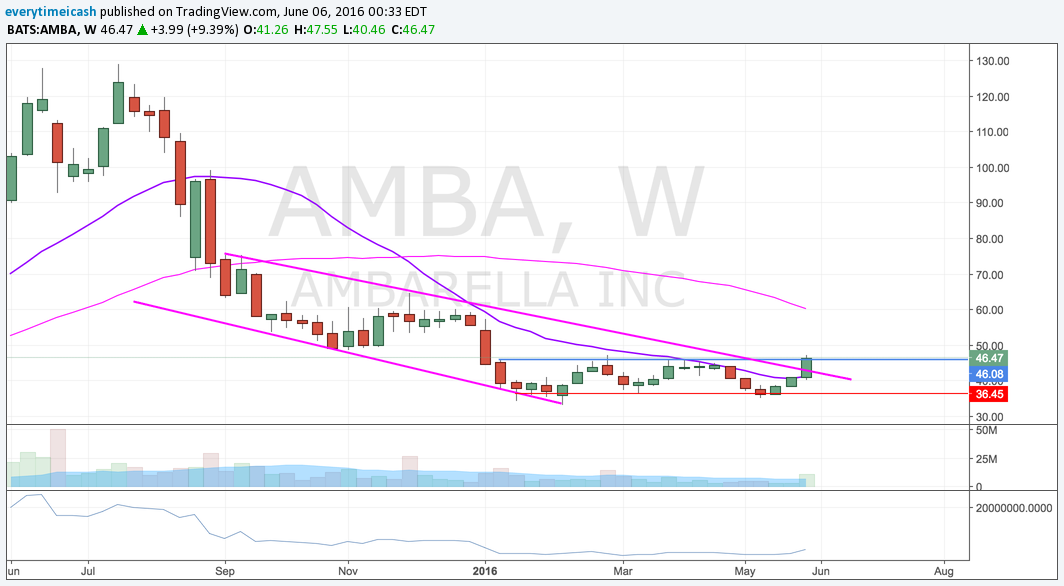
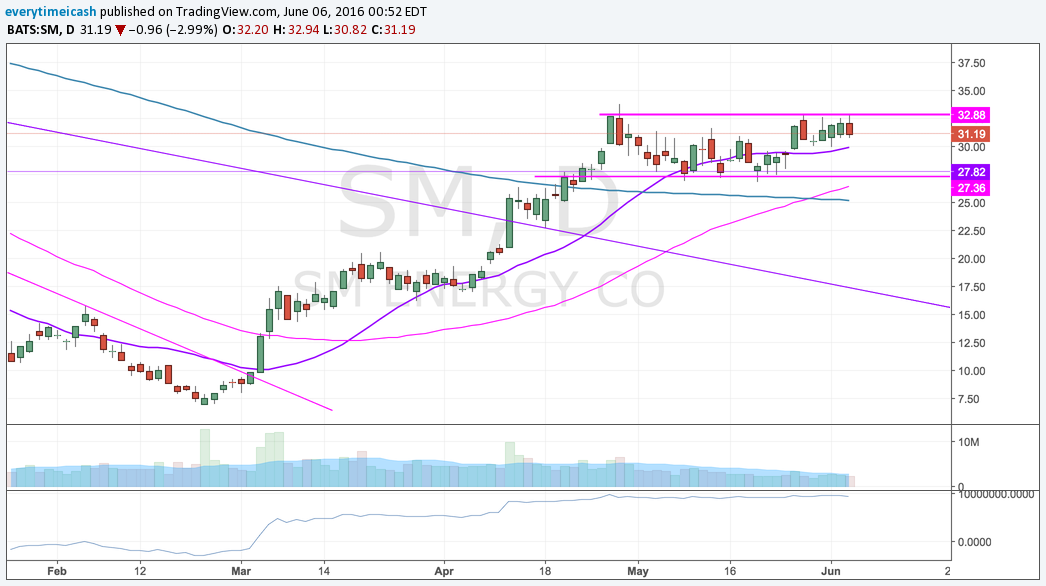
    Heavy short interest, zero debt, channel break, and now an issued buyback. This should catch gas to the flames soon and continue its way higher. Read this post if you are interested in swinging this name and/or want more details.

    BMY

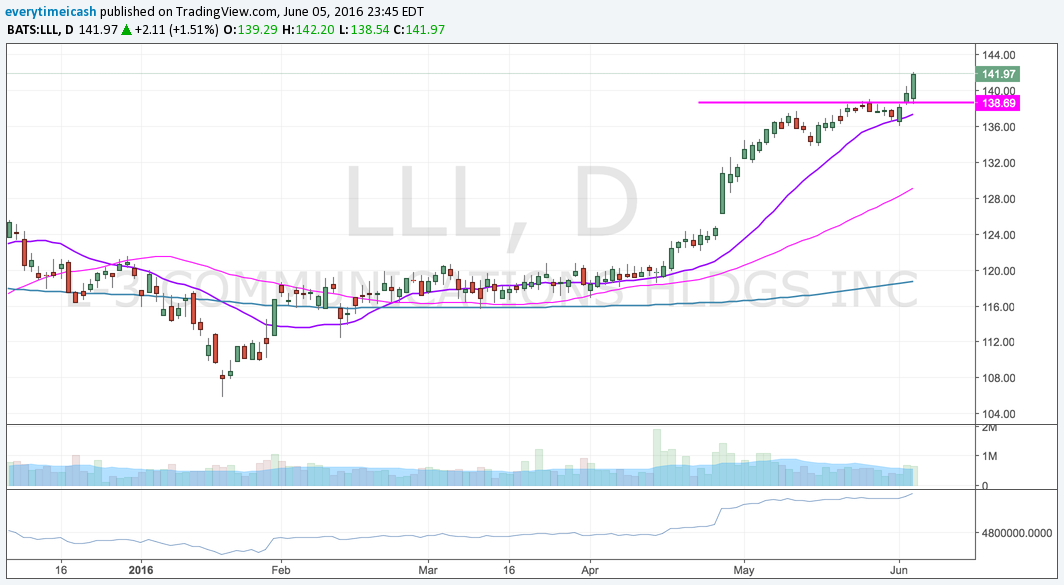
    This name is itching for a breakout. Here is your level.

    HON

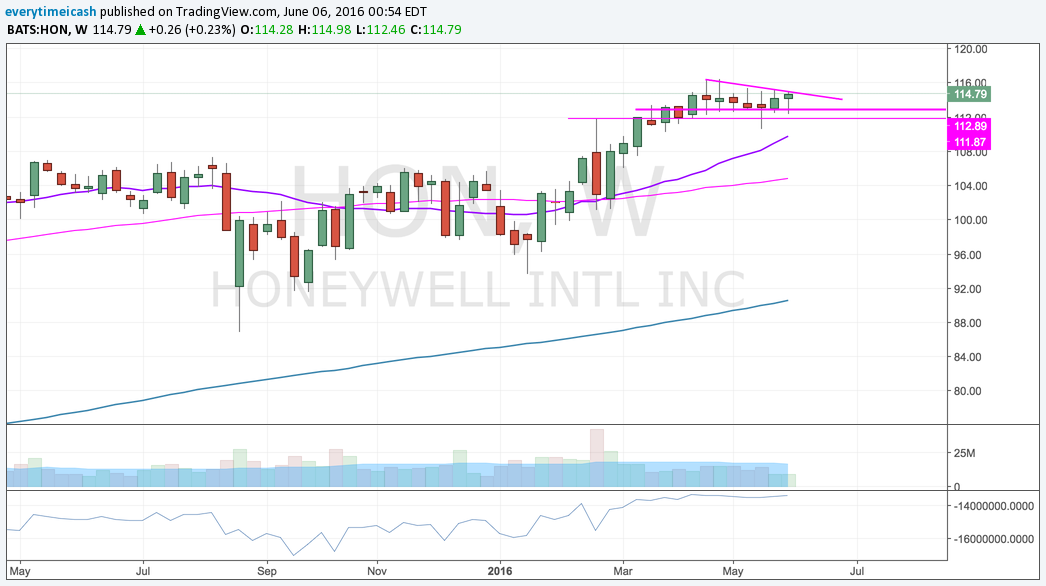
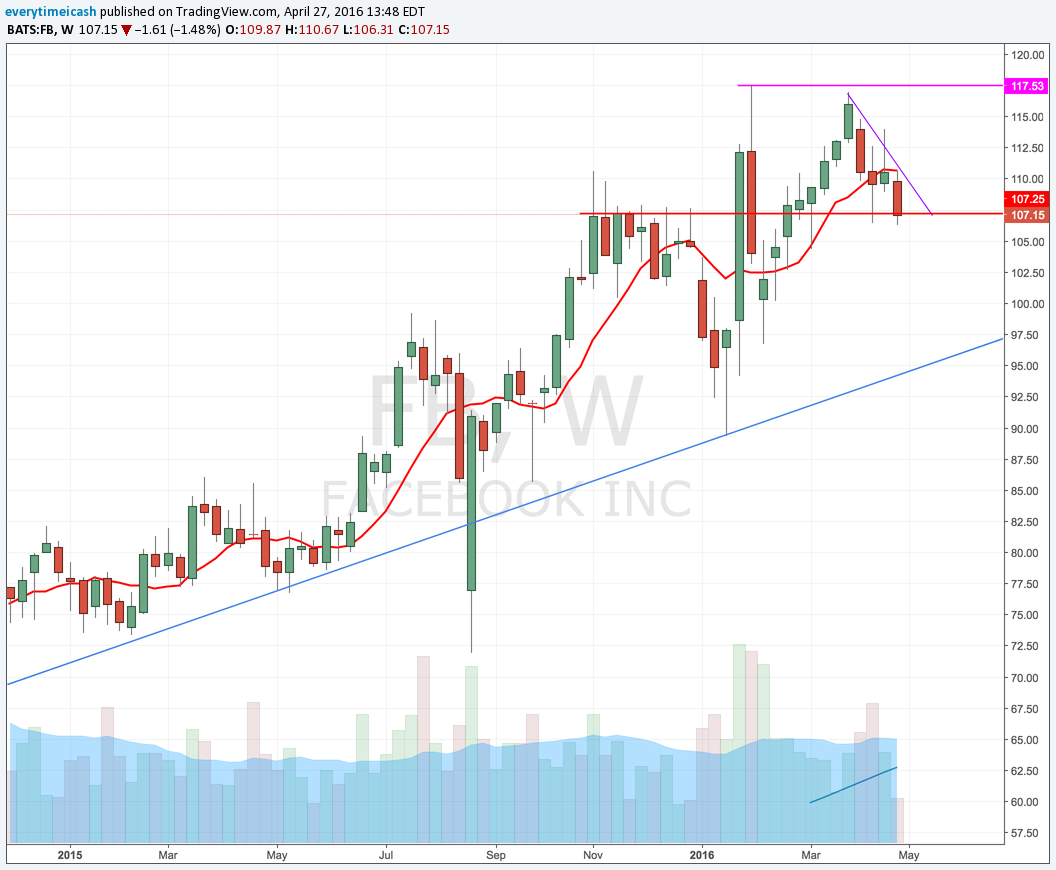
    Flagging with 112 as support. Look for continuation. 

    ICE

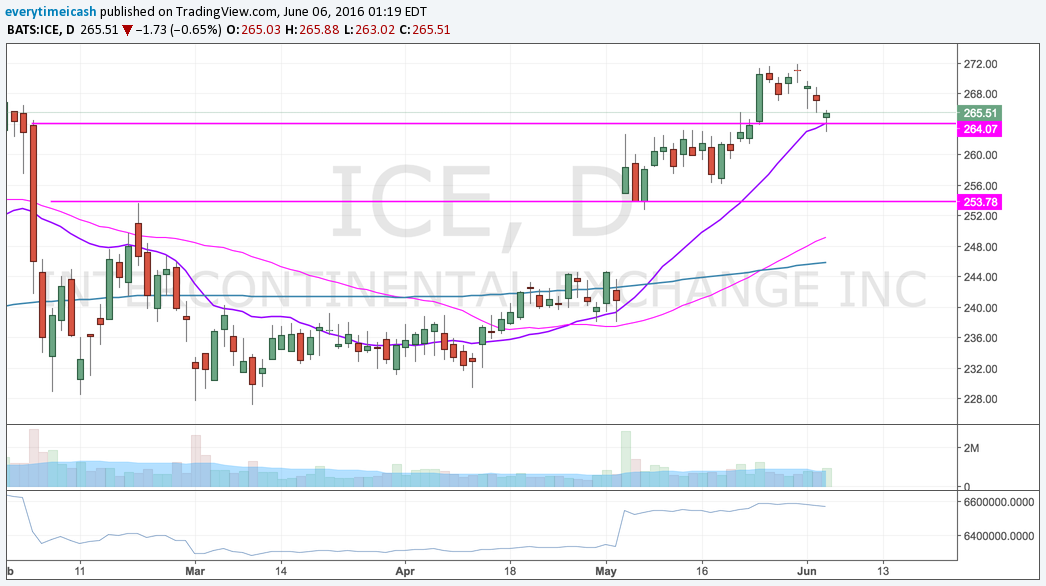
    Backtest of the breakout. Ready to rip again. 

    LLL

    Strongest sector on the board at the moment. After months of consolidation, this sector is set to go. This one may get extended quickly so tread lightly.

    MGM

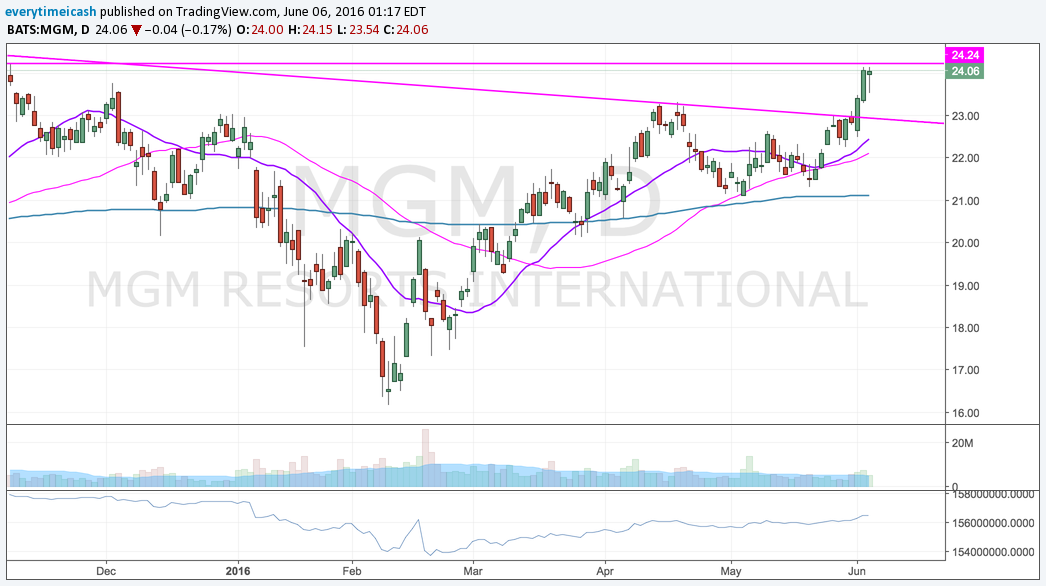
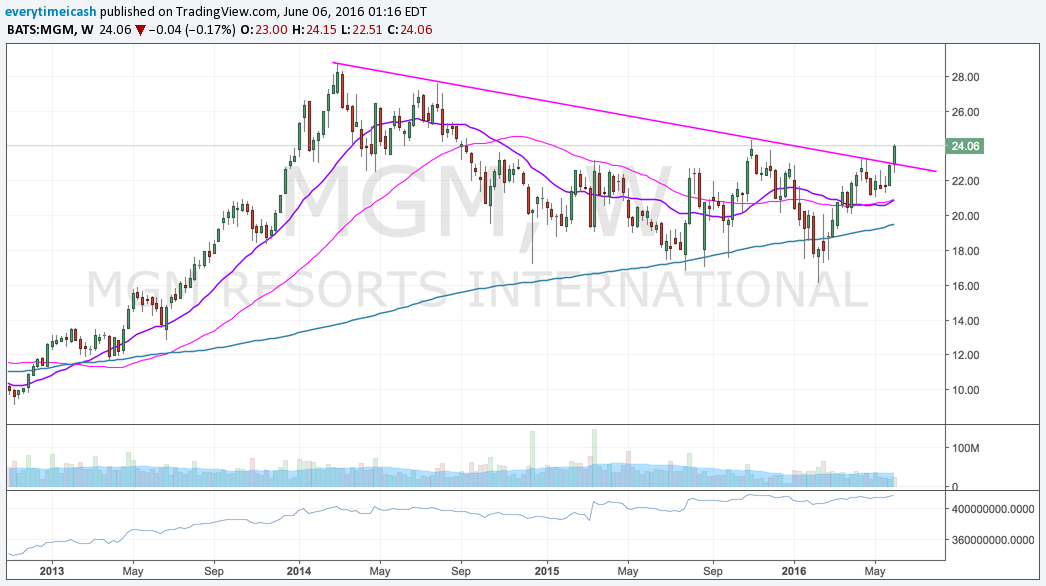
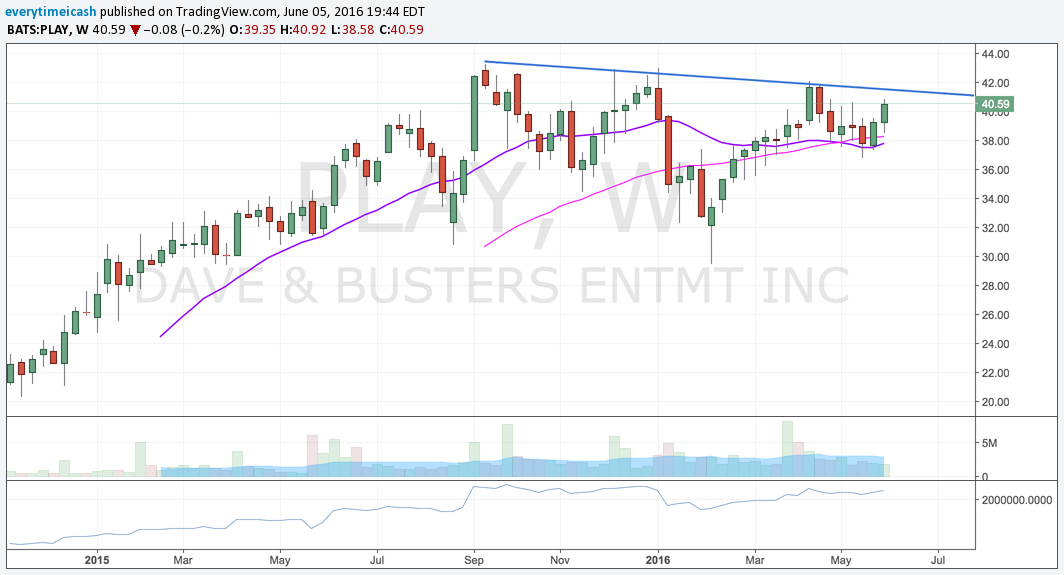
    Broke out of multi-month downtrend. Add it to your bullish list. Lowest Macau exposure of all the casinos. 24.35 will lead to further upside.

    PLAY

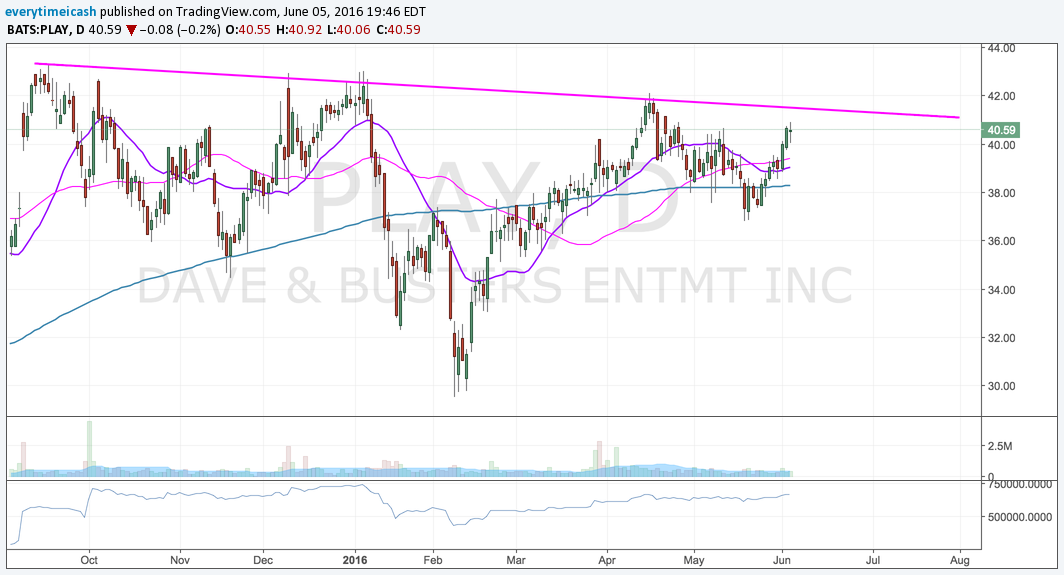
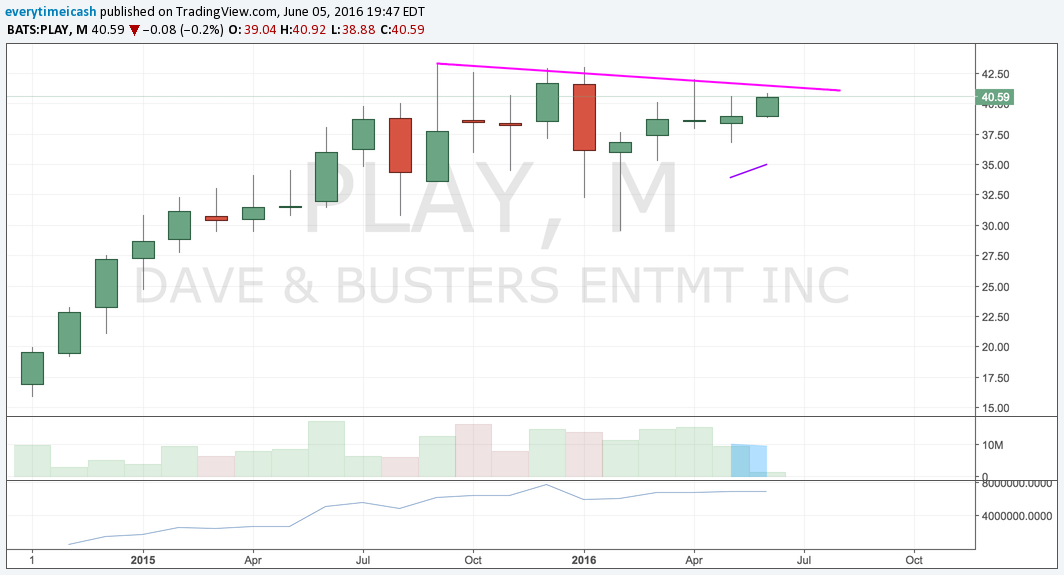
    Clear downtrend about to break on all time frames. Extremely bullish chase if that occurs.

    PCLN

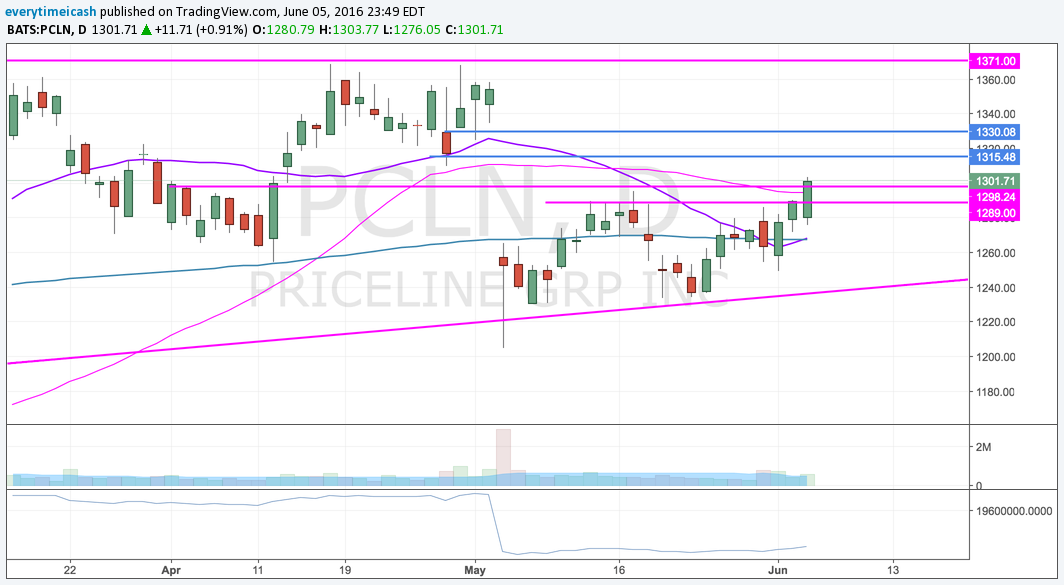
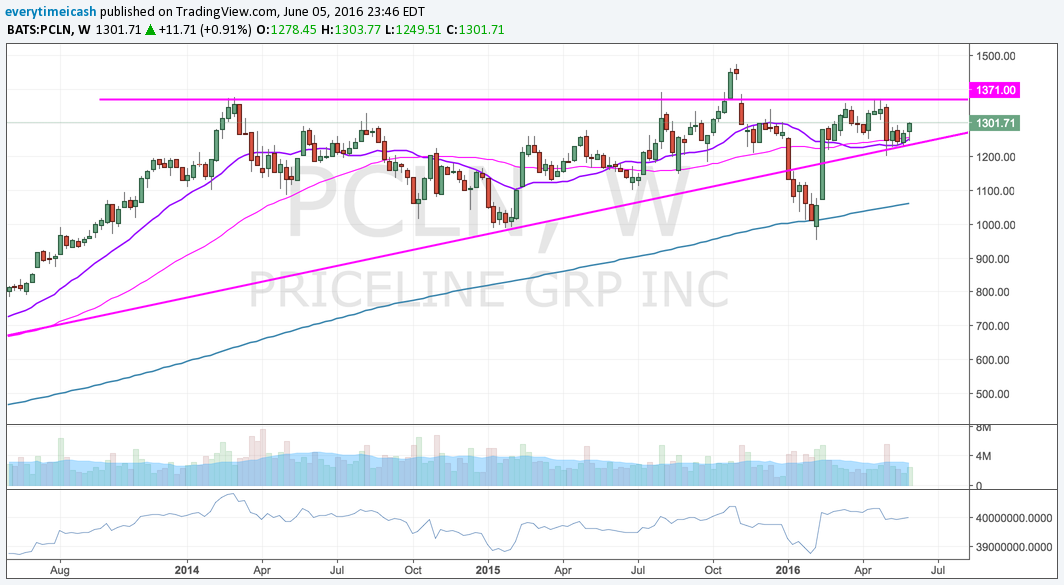
    Faked a breakdown and took off. It has been in an uptrend ever since. If this plays like the market has been of late it's poised to fill the gap into the 1317 1331, and 1340 levels and possibly beyond. 

    RTN

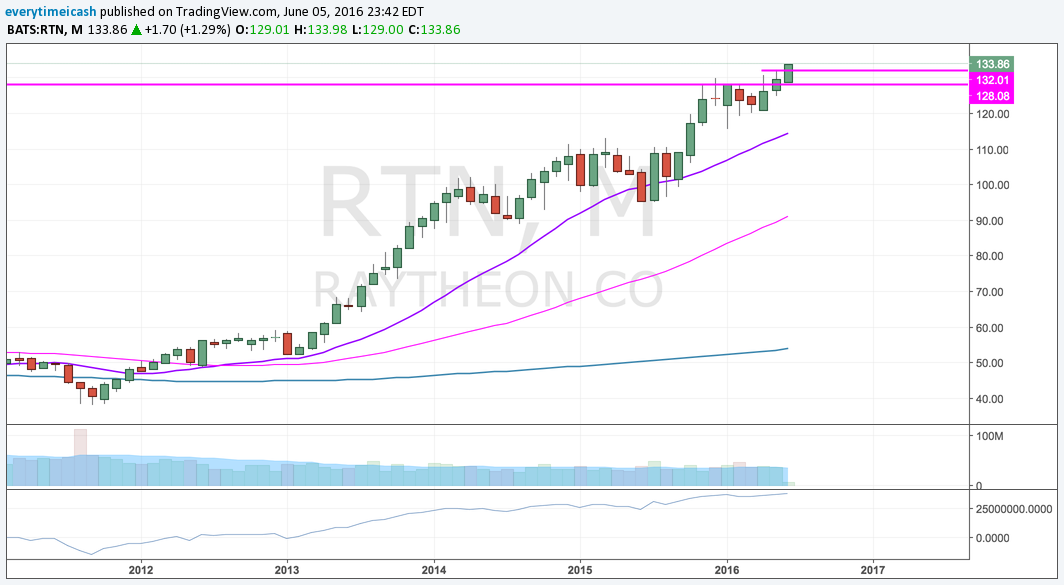
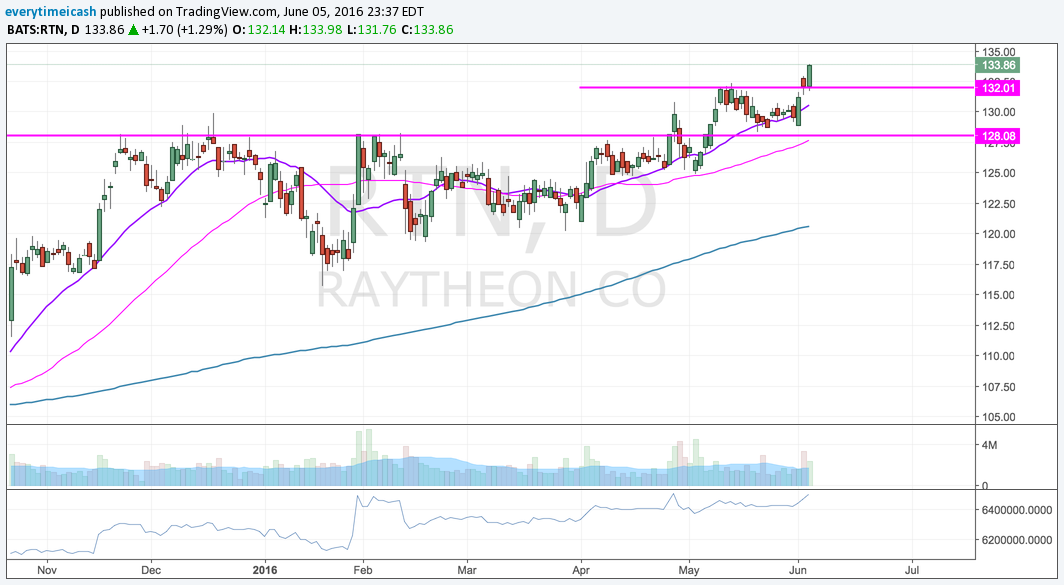
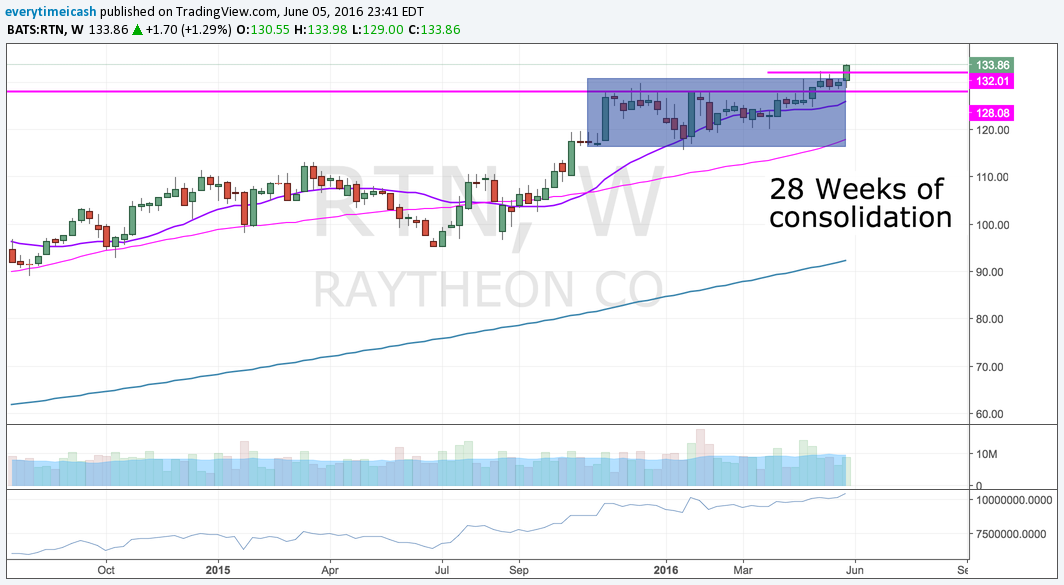
    One of the strongest names in the strongest group. This had 28 weeks of consolidation. Look for a continued breakout. 

    SM 

    Still ready.

    It's Amazin ($AMZN)

    It's Amazin ($AMZN)

    Amazon.com (AMZN) is set to report Q1 earnings today after the close today followed by conference call at 5pm ET. 

    Like Me ($FB Earnings Preview)

    Like Me ($FB Earnings Preview)

    Unlike many other companies, expectations for Facebook remain quite high.  Failure to meet those expectations could cause a material decline in its stock, which is up 31% over the last 52 weeks.

    Ad spending drives Facebook's top line, accounting for 95% of the company's revenue in 2015. FB is a barometer for how advertisers are spending and where they are allocating their advertising budgets.

    Facebook has a large international presence with 86% of its 1.59 billion monthly active users at the end of 2015 residing outside the U.S. and Canada and 50% of its total 2015 revenue derived outside the U.S. and Canada. Facebook, then, will have some revealing insight to share on global economic activity and the impact of foreign currency on its operating results. 

    Facebook is a leadership stock for the Nasdaq and Nasdaq 100. The company and its stock serve as guides for the enthusiasm surrounding the growth of social media

    • Facebook had 1.59 billion monthly active users as of December 31.  Any company with that many users/customers warrants a closer look when it reports earnings.
       

    FB 4th Quarter: 

    • Daily active users (DAUs) were 1.04 billion on average (+17% year-over-year); mobile DAUs were 934 million on average (+25% year-over-year)
    • Monthly active users (MAUs) were 1.59 billion (+14% year-over-year); mobile MAUs were 1.44 billion (+21% year-over-year)
    • The average price per ad was up 21% while total ad impressions increased 29% year-over-year; that was the first quarter since Q3 2013 that total ad impressions increased on a year-over-year basis
    • Faces tougher comparisons given the strong 2015 performance
    • 2016 will be another significant investment year for Facebook
    • Guidance
      • Non-GAAP expense growth of ~45-55% year-over-year
      • Sees capex in the range of $4.0 billion to $4.5 billion
      • Expects to see FX headwinds, particularly in the first half of the year due to tougher comparisons
         

    Tough to be short this stock into earnings, especially at this point.

    Affected Stocks:

    • FB
    • Alphabet (GOOG/GOOGL)
    • Twitter (TWTR)
    • LinkedIn (LNKD)
    • Yelp (YELP)
    • PowerShares QQQ Trust (QQQ)
    • Global X Social Media Index ETF (SOCL)
      • FB is largest holding at 12.3% of assets


    RESULTS:

    Facebook beats by $0.15, beats on revs  

    • Reports Q1 (Mar) earnings of $0.77 per share, $0.15 better than the Capital IQ Consensus of $0.62; revenues rose 51.8% year/year to $5.38 bln vs the $5.26 bln Capital IQ Consensus.
      • Advertising revenue increased 57% y/y to $5.2 bln.
    • Daily active users (DAUs)- DAUs were 1.09 billion on average for March 2016, an increase of 16% year-over-year.
      • Mobile DAUs- Mobile DAUs were 989 million on average for March 2016, an increase of 24% year-over-year.
    • Monthly active users (MAUs- MAUs were 1.65 billion as of March 31, 2016, an increase of 15% year-over-year.

      • Mobile MAUs- Mobile MAUs were 1.51 billion as of March 31, 2016, an increase of 21% year-over-year.

    • Mobile advertising revenue- Mobile advertising revenue represented approximately 82% of advertising revenue for the first quarter of 2016, up from 73% of advertising revenue in the first quarter of 2015.
    • Capital expenditures- Capital expenditures for the first quarter of 2016 were $1.13 billion.
    • Free cash flow for the first quarter of 2016 was $1.85 billion.

    🔥🔥MONSTER QUARTER, AGAIN. THEY'RE KILLING THEIR "COMPETITION"🔥🔥


    Facebook announces proposal of new class of stock

    FB announced that the board of directors has approved a proposal to amend and restate existing certificate of incorporation to create a new class of non-voting capital stock, known as the Class C capital stock.

    If approved, it will issue two shares of Class C capital stock as a one-time stock dividend in respect of each outstanding share of our Class A and Class B common stock. This proposal is designed to create a capital structure that will encourage Mr. Zuckerberg to remain in an active leadership role at Facebook. 

    The adoption of the proposal is subject to the approval of our stockholders at our 2016 Annual Meeting of Stockholders to be held on June 20, 2016.
    — FACEBOOK

    Facebook Conference Call Highlights

    • Apps continue to show momentum.
    • Mobile continues to drive growth.
    • Mobile ads being driven by supply and demand; demand- investments to improve solutions

    Q1 Avg Price per ad increased 5%; total ad impressions increased 50%; strong growth in mobile ad impressions.

    • Will face tougher comps in 2016 given acceleration of ad growth in 2015
    • Payment fees revenue will also see headwind even with Oculus; expects y/y decline.
    • Expense Outlook remains unchanged at Non-GAAP growth of 45-55%; Amortization will be $700-800 mln; SBC $1.1-1.3 bln in 2016; CapEx will be at the high end of $4.0-4.5 bln range previously given; Q2 and FY16 tax rates should be similar to Q1. 

    FB breaks through all time high on stellar report, again. 

    $FB prints 119.44 ALL TIME HIGH after hours.