

Current street estimates call for GAAP breakeven EPS on revs of $86.64 mln. Etsy's earnings the last two quarters have hit the wires within the first five minutes after the market has closed. In the event ETSY discusses its forward looking guidance, here are the current street expectations for Q1 and FY16
Q1: GAAP EPS of ($0.04), w/ revs +29.4% y/y to $75.74 mln
FY16: GAAP EPS of ($0.10), w/ revs +27.9% y/y to $347.9 mln
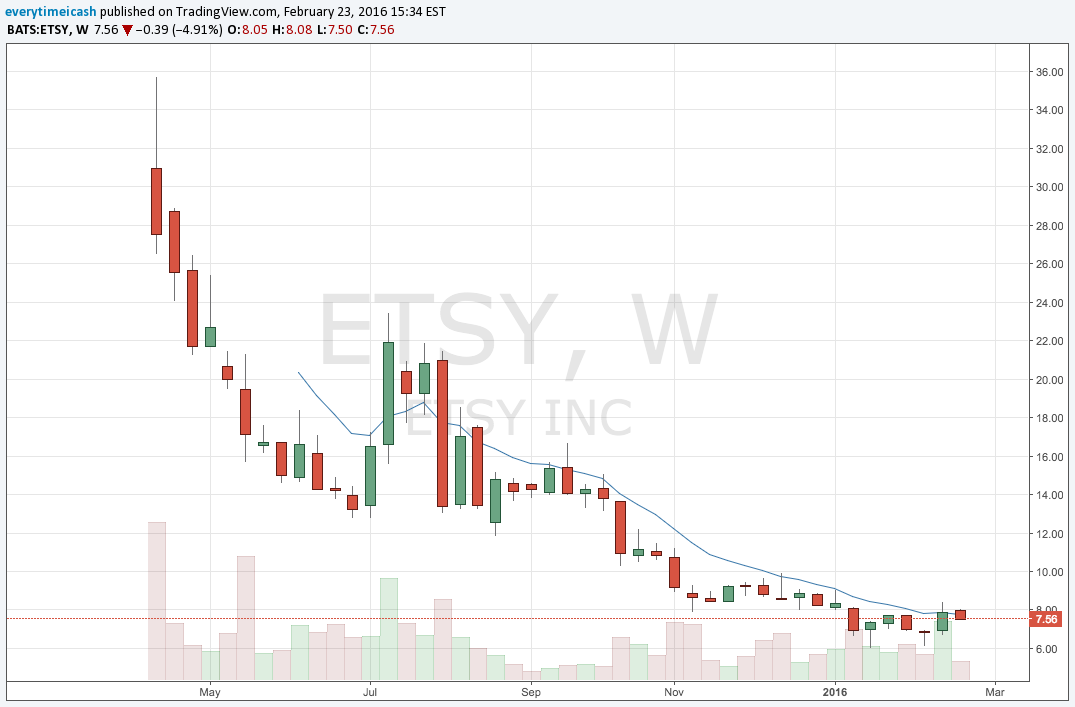
After dropping to fresh post-IPO lows just above $6.00 (The IPO priced at $16.00 and opened at $31.00 on 4/16/15) earlier this year, shares have seen some recent interest following the disclosure of new positions taken in Q4 by hedge funds Paulson & Co and Kerrisdale Capital. Still, shares are down 50% from the IPO pricing and 78% from their all-time highs seen its first day of trading. Growth continues to be closely watched amid competition from Amazon and eBay.
Highlights from Last Quarter
Reported Q3 (Sep) loss of $0.06 per share, in-line with the two analyst estimate of ($0.06); revenues rose 38.0% year/year to $65.7 mln vs the $66.39 mln Capital IQ Consensus.
GMS was $568.8 million, up 21.7% compared with the third quarter of 2014. Growth in GMS was driven by 19.4% year-over-year growth in active sellers and 24.9% year-over-year growth in active buyers.
To real time alerts, trades, market insights, and private content.
- Commented on expected performance for Q4:
- "First, from an overall business perspective, we're excited about our competitive position as we head into the fourth quarter - our biggest quarter of the year - and the holiday season. We have launched a holiday campaign that we believe is our strongest holiday effort to date.
- Even so, just as we conveyed in the first and second quarters of 2015, if currency exchange rates remain at current levels, then currency translation will continue to negatively affect reported GMS growth for goods that are not listed in U.S. dollars and will also continue to dampen the demand for U.S. dollar-denominated goods from buyers outside of the United States.
- The second qualitative factor we'd like to highlight is that from a modeling perspective, the operating leverage that we achieved in the third quarter will not repeat in the fourth quarter for a few reasons"
Options Analysis
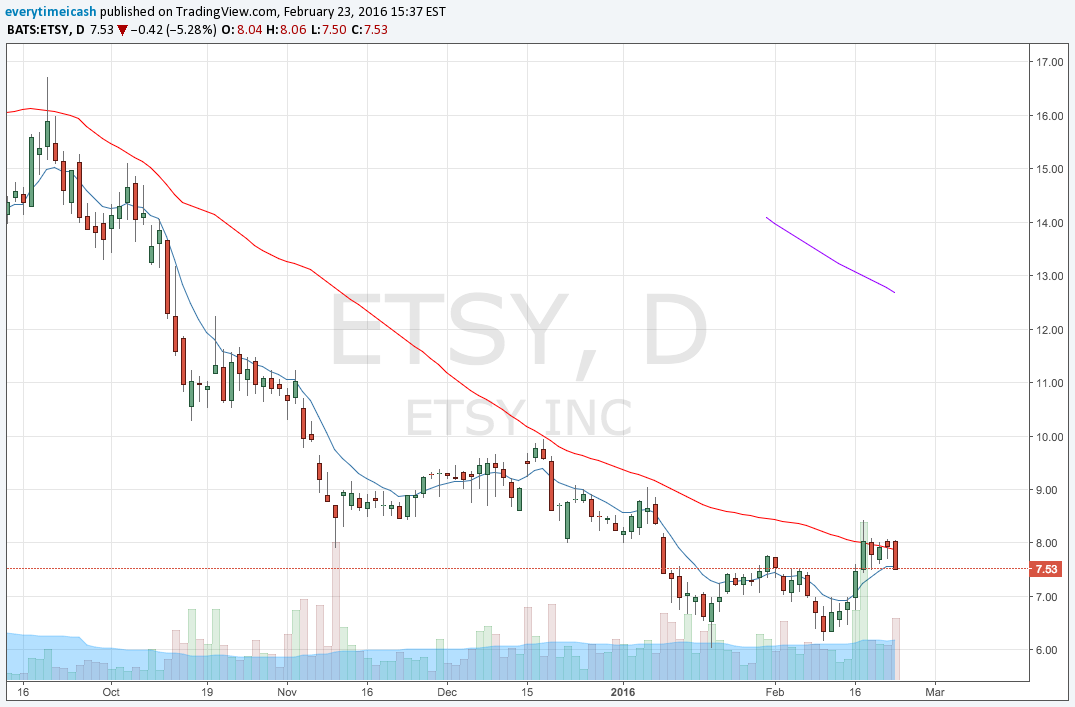
Based on ETSY options, the current implied volatility stands at ~ 102%, which in 42% higher than the historical volatility (over the past 30 days). Based on the ETSY March $7.5 straddle, the options market is currently pricing in a move of ~21% in either direction by March expiration (March 18th).
Technical Analysis
- Technically the stock has been significantly under-performing since last summer, losing nearly -75% off its July peak of 23.44. The $8-level is currently acting as resistance with its down-sloping 50-day moving average in play. A positive reaction to earnings could put it back on the radar of Buyers if it clears that downtrend, with a potential target at the $10-mark. A negative response to earnings will likely bring its Jan/Feb lows in play as possible support along the $6-level.
With recent institutional adds and with what appears to be a rounding bottom downside risk is limited in this one.
BIAS: BUY
Current position: STO Mar 5 Puts
RESULTS
Etsy misses by $0.04, beats on revs; guides FY16 revs below consensus; sets 2018 targets
- Reports Q4 (Dec) GAAP loss of $0.04 per share, $0.04 worse than the two analyst estimate of ($0.00); revenues rose 35.4% year/year to $87.9 mln vs the $86.64 mln Capital IQ Consensus; GMS +21% to $741.5 mln; adj. EBITDA +51% to $14 mln. Growth in GMS was driven by 15.5% year-over-year growth in active sellers and 21.4% year-over-year growth in active buyers.
- Co issues downside guidance for FY16, sees FY16 revs at high end of (+20-25% YoY) ~$328-342 mln vs. $347.90 mln Capital IQ Consensus Estimate.
What looked like a repeat disaster was uplifted by the following statements made by the company:
"We expect to achieve a three-year revenue CAGR in the 20-25% range and a three-year GMS CAGR in the 13-17% range. In 2016, we expect revenue growth to be at the high end of our three-year range and GMS growth to be near the mid-point of our three-year range... We expect to exit 2018 with a full-year gross margin that is in the mid-60s percent range, and that 2016 gross margin will be in this range as well... Finally, from an Adjusted EBITDA margin perspective, we estimate that our margin in 2016 will be comparable to 2015 in the 10-11% range and that it will expand to the high teens range by the end of 2018."