Netflix (NFLX) will report fourth quarter results in a Letter to Shareholders on its website soon after the bell.
Wolf's Den
Viewing entries in
Weekly Setups
Netflix (NFLX) will report fourth quarter results in a Letter to Shareholders on its website soon after the bell.
We have seen this type of scenario play out to upside breakouts
NVIDIA (NVDA 149.28, -0.80, -0.5%) will report its Q2 results after today's closing bell, followed by a conference call at 17:30 ET.
Canada Goose (GOOS) will report Q1 before the market opens tomorrow
Apple (AAPL) will report third quarter earnings this afternoon with a call at 5:00 PM.
AMD will report its Q2 results after today's closing bell
When the easy money is over, walk away. Or flip sides.
McDonald's (MCD) is set to report Q2 results tomorrow before the open with a call to follow at 11am ET.
Twitter (TWTR) will second quarter report earnings tomorrow before the open.
Alphabet, Google (GOOG/GOOGL), will report second quarter results this afternoon.
Snap is scheduled to report its Q2 results this afternoon.
Boeing (BA) is set to report Q2 results tomorrow before the open.
The internet, specifically FinTwit, is full of charlatans and snake oil salesmen telling you that their magical tricks will get you to your wildest dreams. The reality is most are average at best and don't espouse any real tangible knowledge or give you an edge. So it is because of this, and because when markets get rocky my inbox blows up, that I wanted to take a moment and give my personal insight on the most common question I get asked.
As someone who has been trading transparently for three years now I often hear the same questions. No question is more prevalent however than "How do I know how much to put on a trade?"
As a part of my "service" we offer individuals a spreadsheet that gives them an idea of what their overall risk tolerance should be dependent on their trade size. The spreadsheet also works in reverse. This is predominantly "basic math" but let's just go over it quickly. For example, if I am okay with losing $250 on a position and the options price is going for $1.00 my position sizing/risk tolerance will be the following according to my parameters set above:
Obviously, the larger the position size the more you have to "thread the needle" for that position.
The second most common question I get:
Absent of allegations of fraud or takeover noise, there is no "sure fire" way to tell just how far a stock can go both up or down. There are however tools/edges at your disposal to give you a sense of when you can/should leverage or when you can expect the potential for an outsized move. Notice I said "potential" in the above sentence. At the end of the day regardless of expectations or rationale, the market is irrational, and more often than not that is costly to your bottom line.
In simple terms, your options should be how far you perceive the move in question will in fact travel. Take into account that you want to be reasonable with your assessment and try keep your price objective within the measured move of the stock.
With the above diatribe over with, I want to share an example the above in action. Specifically how you can leverage father out of the money on major breaks (up or down) to get outsized returns on your capital. For the purposes of this exercise I want to highlight Facebook (FB).
There are particular times when it is prudent to take stabs at exaggerative moves in the market. Though every trend book will tell you buy the breakouts and sell the breakdowns and you'll make money easily, that is not always the case. There are some key factors that can help you with your decision making process. Specifically I've found the following three items to consider prior to taking a potential trade.
The first item I consider when taking a trade is the overall market. The questions being, what is the stock market currently doing? How is it preforming relative to the position I want to enter?
Put in layman's terms; do I want to short or go long? Is the overall market suggesting I should short or go long?
If you think of stocks as boats and the overall market as the river they flow on, you predominantly want to be in a boat attempting to go with the tide.
Since 70% of stocks tend to move with the overall market trying to move in the opposite direction is not prudent for your overall success. If I can put this scenario in a blunt image for you, don't be the stray gazelle in the Serengeti. We all know how that ends.

Don't Get Slaughtered
When taking a position, it is important to take note of if there is a catalyst at play for your move. Though not always necessary, if there is a catalyst, it does bolster the chances of our thesis coming to fruition. If we're using the boat analogy from above, a little wind in the direction you're going definitely gets your sailboat moving more quickly. Conversely, if there is an opposing catalyst, your chances for may be impeded.
This one is quite simple. Is there a particular trend for your stock? Or is it just dead money? It is more likely for your position to be accurate if you are trading either with the trend or when the trend breaks.
If you are trying to go long a stock, more often than not, staying with the uptrend for that stock will be beneficial for your overall success. That is of course unless the overall trend breaks. In that particular case trying for the opposite could prove to provide more bang for your buck.
As a general rule, the longer a trend the harder it is to break. Secondly, most trends don't break on their first attempt, but rather after multiple attempts at breaking.
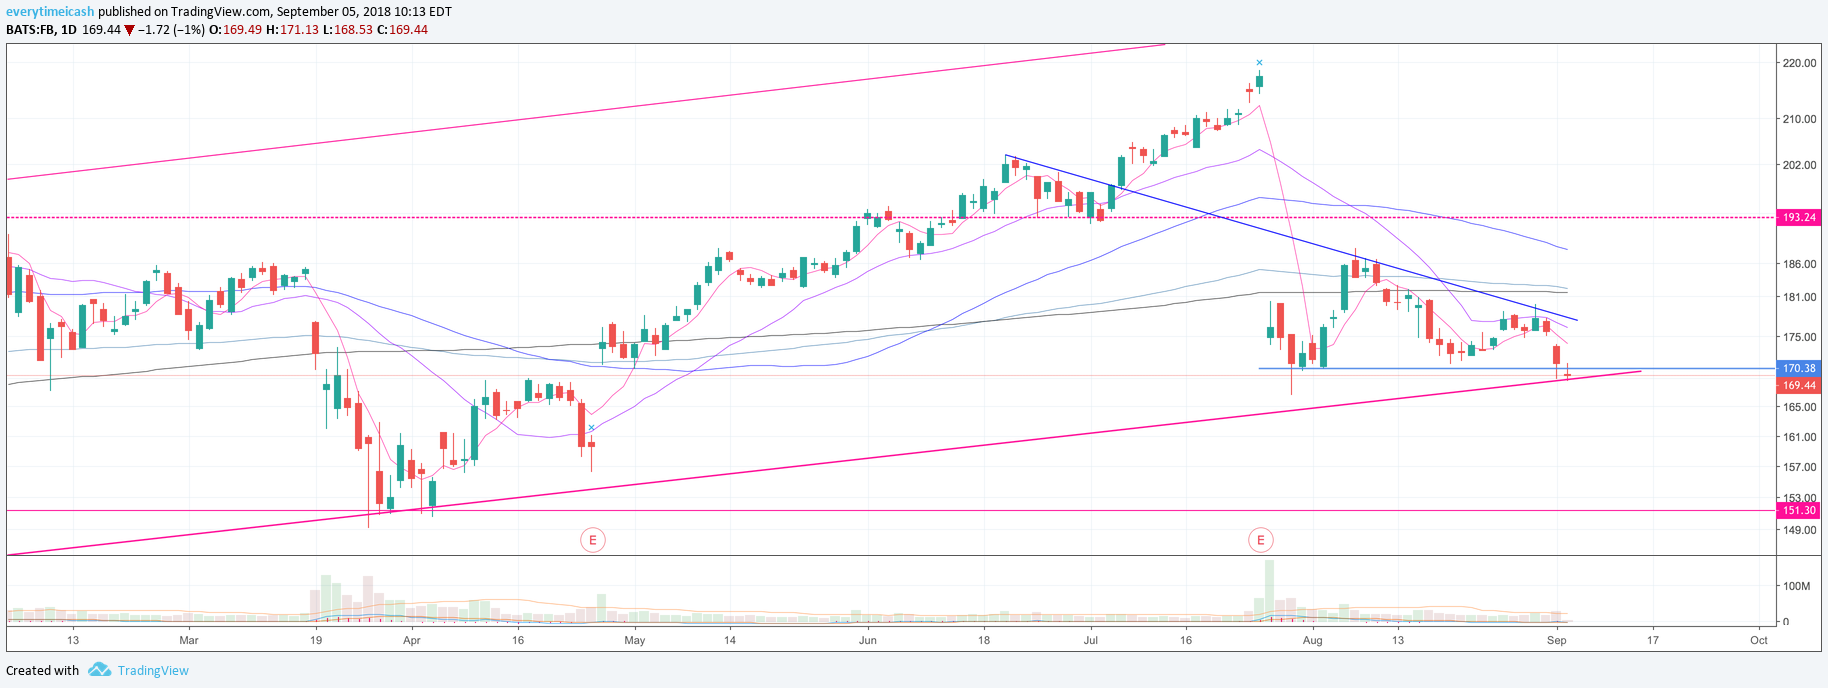
I want to give an overall picture of the above in action. For this I will focus my attention on this week's FB trade. Going into the week FB had not traded particularly well as it finished August below its major MA's without the ability of breaking out.

FB Daily
As the above shows, Facebook was unable to break above a downtrend set prior to its blowoff top prior to earnings.
This next image shows how FB had been holding 170 as support after it's earnings report.
FB 170 support
With the above in consideration, let's zoom out and consider any long term trends for FB.

FB Weekly
Taking a look at the above, we notice that FB has been in a 4 year channel from April 2014. Like clockwork, the buys have come in on the bottom and the sells on the top. This channel was defended recently as well following a disastrous earnings report. That being said, FB had been acting weak and they were slated to present in front of congress again. The overall market wasn't helping either, as buyers abandoned ship yesterday seemingly being topped out by the AMZN $1T rejection one day prior.
As the above was taking place we began stalking FB in the chat yesterday. I first highlighted it around 10am EST and gave the chart for the wedge it had formed and the long term trend. I then followed it up with an alert, taking the out of the money weekly 165P's as the stock hung precariously on the edge. Since the trend line in question is a four year trend line, I found it appropriate to leverage with farther out of the money puts in this case. Though this is how I chose to take my first attempt at this trade, this is not a practice that I encourage typically. More often than not, being too far out of the money will result in you wasting your money.
This position ended up working out for us immediately once the 170 level broke as the stock careened into 167.5 before finding some floor with the overall market. Unfortunately however, the stock did in fact find a floor and I was stopped out of a majority of my original position as it started to rebound. The stock started to form a new range between 167.5 and 169. It was important to make not of the breakdown level from that point on to decide whether or not to re-enter a position into the close. Secondly, it was important to note as a break of the lows would create further selling pressure. As the stock broke the intraday lows it was prudent to reapply my short of the stock; and thats exactly what we did.
With the stock selling into the close and breaking a multiyear trend, I found it prudent to put on an overnight position for the hopes of further selling and I'd make note of the previous days lows to get more aggressive with the stock should those lows continue to break. (highlighted below)
FB would be back on the top of my watch list yet again today. Within minutes, the overnight put position was in my favor and I could rest easy and raise my stops. From that point on, I made note of the previous day's close and the opening range lows as another catalyst point for selling as shown below.


The stock attempted to find a floor in the first half hour and subsequently attempted a run at the days opening price. A failure of that price suggested that any break below the opening range would result ini further downside. This was a safe bet as the stock had already broken a multiyear trend and closed on the lows just one day prior. With that in mind, and with a breakdown of the ORB I found it prudent to get more aggressive. I raised my stops on the overnight position again and added more puts (highlighted by the arrow below).
As you'll notice, once the position was on, the stock never recovered. It continued its escalator down until it came close to the 160 round number. By that time, we were all out of our puts and had rolled down our winners.
As a rule of thumb, I like to sell ~50% my winners once I see a 2x return. This allows me to avoid micromanaging the position and allows me to let it run its course to completion. All in all this trade worked out and was quite lucrative.

Some of the FB profits
I opted to write this post primarily for two reasons: first, because I thought I'd finally put some of the "rules" I follow in writing to help answer some of the recurring questions I see/hear. Secondly, as I stated above, during times of market volatility my inbox blows up. This is an easy way to address all the common concerns and questions in one swoop. If you found this post helpful, please like and share it. If you'd like to learn more about how we trade feel free to reach out to me using the contact link on my website. As I stated, more and more people contact me during volatility. It is important to state, not all markets behave the same and this is not some cookie cutter method.
If you'd like to follow my trades in real time click the "Join Now" button at the bottom of the page. For those that will and have asked, in honor of my birthday I am giving anyone who signs up a discount to start. Just use the code GUEST on checkout.
Kohl's (KSS) is set to report Q4 results before the bell tomorrow (8:30am ET). Cap IQ Consensus estimates Q4 EPS of $1.33 (vs. $1.58 in 4Q15), and revs of $6.21 bln (-3.1%) with comps down 2.1%
Gilead Sciences (GILD) will report Q4 results after the close with a conference call to follow at 4:30pm ET. GILD is expected to report earnings at 4:01pm. Current Capital IQ consensus stands at EPS of $2.60 and Revenues of $7.175 bln.
IBM (IBM) will report Q4 results tonight after the bell with a conference call scheduled to start at 5:00 p.m. ET. Usually, IBM reports within the first 10 minutes after the bell.
Gigamon dives -18% on guidance; trading down near $38 after-hours. Next major area of support near June's breakout. This could be a foreshadow for darling stock NVDA IF they ever miss/soften their guidance.
To me there are fewer setups that look as appetizing as Tesla this year. The stock has been lashed out at by bears for two years and has seemingly had everything thrown at it. With that, and barring a completely overall bear meltdown, I find it hard for the investors in the stock to ring the register this year.
TSLA has been consolidating on a monthly basis.
With the slated Model 3 deliveries, 2017 marks the year that the Tesla mass consumer comes online. With that comes a new revenue stream and the growth dynamic back into play.
The automaker took 400,000 pre-orders for the Model 3 within weeks of revealing the prototype. The main issue they face is producing millions of them, on time, up to quality standards, and most importantly; without losing money. Tesla doubled their production in 2016 to 100,000 cars. In April, Musk said he wants to produce half a million cars by 2020. One month later, he said they’d get there by 2018. Aggressive as that may be, Musk seems to deliver under pressure. The Model 3’s biggest hinderance on performance deliveries are projections, expectations, and supply chain. With expectations coming as a result of projections, supply chain will be your tell with the company’s ability to deliver results.
Many analysts who bash Tesla’s stock will have you know that there is a steady increase in competition in recent years. They’re full of shit. Tesla operates in the high end electric vehicle market. Until now, they’ve been the only real player. Recently Fisker, Farady Future , and Lucid Motors have perked up to compete but until now there really hasn’t been a viable competitor.
The main difference however is that Tesla has centered itself on building a network and working outward. SImilar to the Apple vs everybody model, Tesla has open sourced its technology and focused its attention on building a sustainable network/brand first then focus on its product offerings. That’s why the term “Cult Stock” has often been used to describe the company/stock.
As I’ve said above, Tesla has been range bound for nearly two years now. In early 2015, the stock broke it’s 180 “support” level and found itself bouncing sharply off of its 200 week MA. Since then the stock made a high at nearly 270 and then a failure and hold of the 180 level yet again. As of late the stock has once again broken out of its downtrend and appears to be acting constructively. With the addition of Elon Musk to the Trump Advisory team, the short interest, new product offering, and constructive behavior, this stock is set to rip in 2017.
One key amendment to this argument is the price of oil. Which since the Barron’s $20 oil cover, has been constructive and working its way higher. All of these instances bode well for Tesla which I believe has a very defined stop ($180) and a potential to break out to an all time high.
TSLA’s gigafactory goes active in 2017 making them the largest battery operator/manufacturer in the world. This will provide countless jobs as well as margin expansion. This will likely bode well for TSLA moving forward with the Trump Administration and as such bears are going to get squeezed.
To play this stock’s potential, I’ll be putting on a leaped call spread (bullish risk reversal) with the Jan 2019 350 C being bought and the Jan 19 100 P being sold. (You can also buy a lower put strike to hedge your downside risk as well.) This prices that Tesla will see a 50% gain in the next two years which “sounds crazy” but isn’t anywhere near crazy given this stock’s price action/ability. At the time of writing, this position cost a net debit of ~$2.2.
As I've been telling you guys for months now, the rate increase is not likely to occur in June and most likely to occur in July. My rationale for this has always been two fold: 1) Brexit and 2)A rate hike now is too soon and one in September is too close to the election. Last week's data gave the markets a quick rattle but by the end of it investors and traders had been calmed by the depreciation in likelihood that the Fed would move in June. Well like a kid turning his homework in late, the market seems to be peeking over its shoulder at the Brexit event looming. With that, the market is pricing a lower possibility for a rate hike in June.
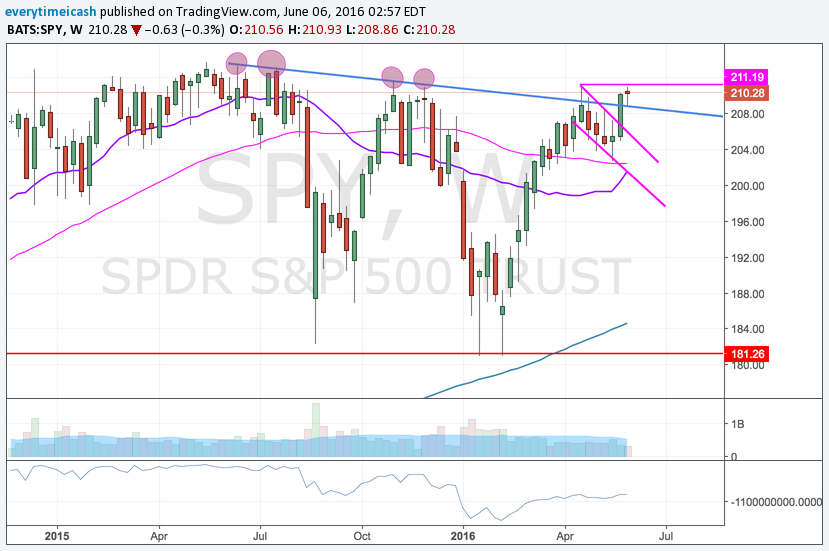
That said, we are sitting at 2100 with the potential of an all time high breakout in the stock market. My bias is that we will eventually take out the highs, continue to rally and cause capitulation before ultimately falling apart. So for now, the pain trade remains to the upside until a catalyst occurs to "shake things up". With that in mind, I'm focusing primarily on stocks that are poised for higher. Below are the SPY charts to keep an eye out including a FIBS chart for potential resistance.
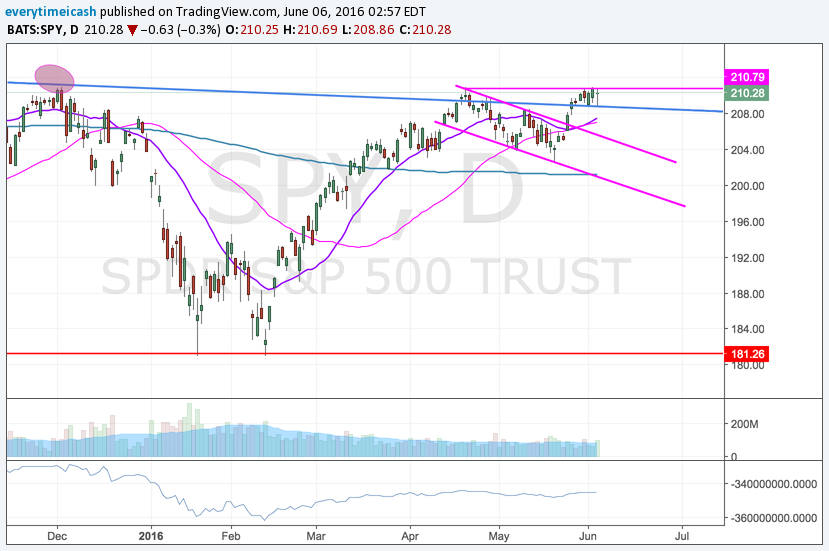
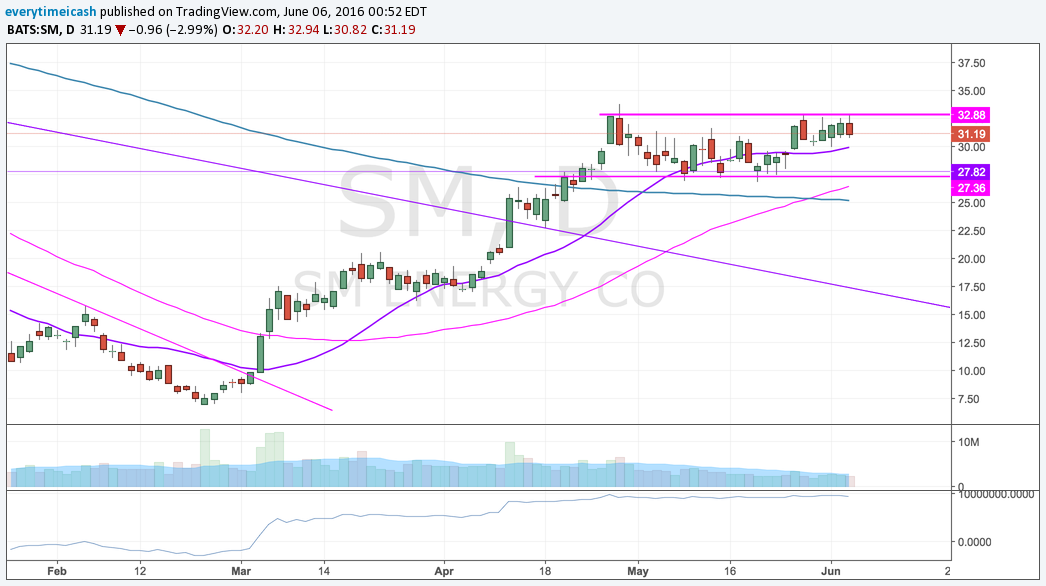
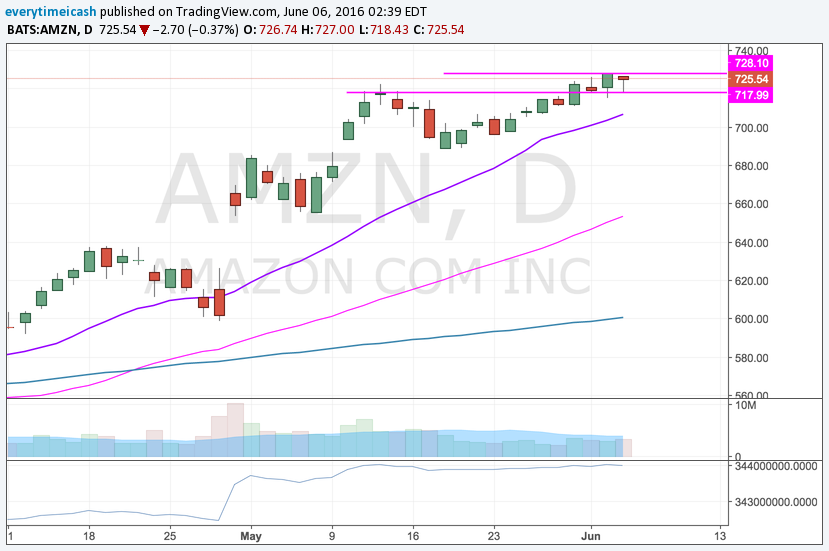
Winner winner. 717 support.
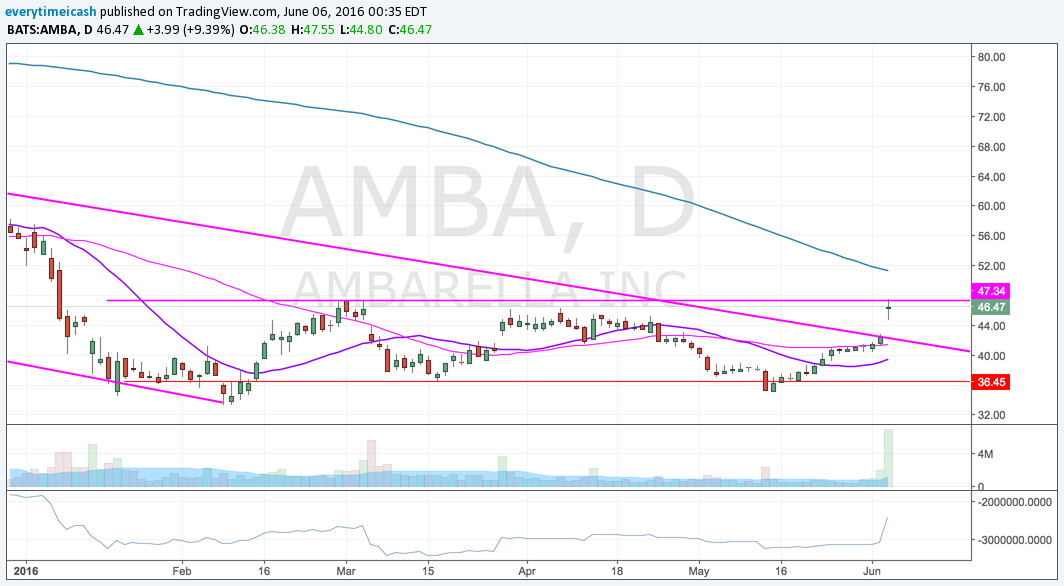
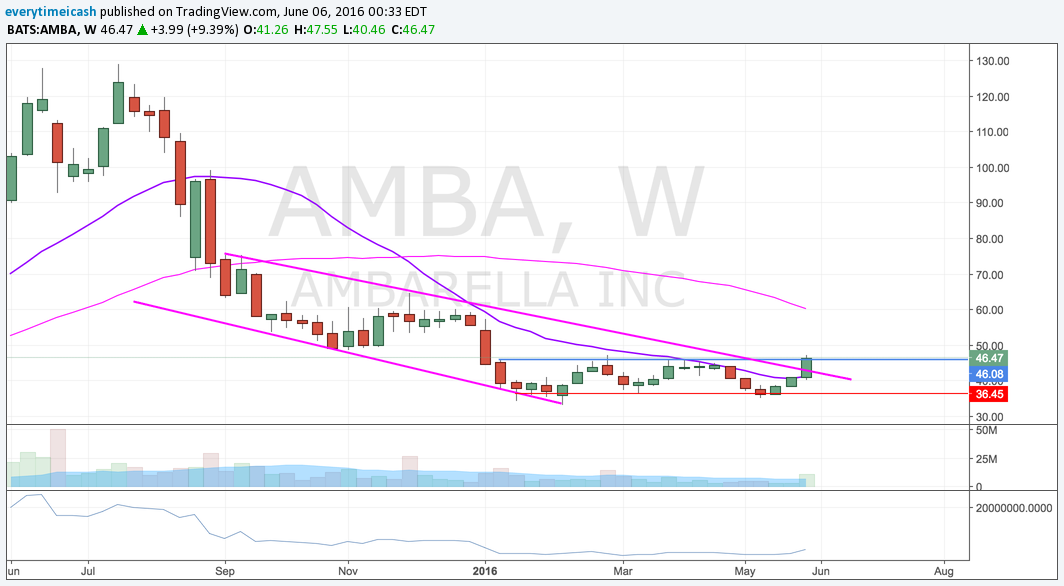
Could be at support retest, could be a cup and handle, could be a rollover. It all depends on how 97.5 will hold.
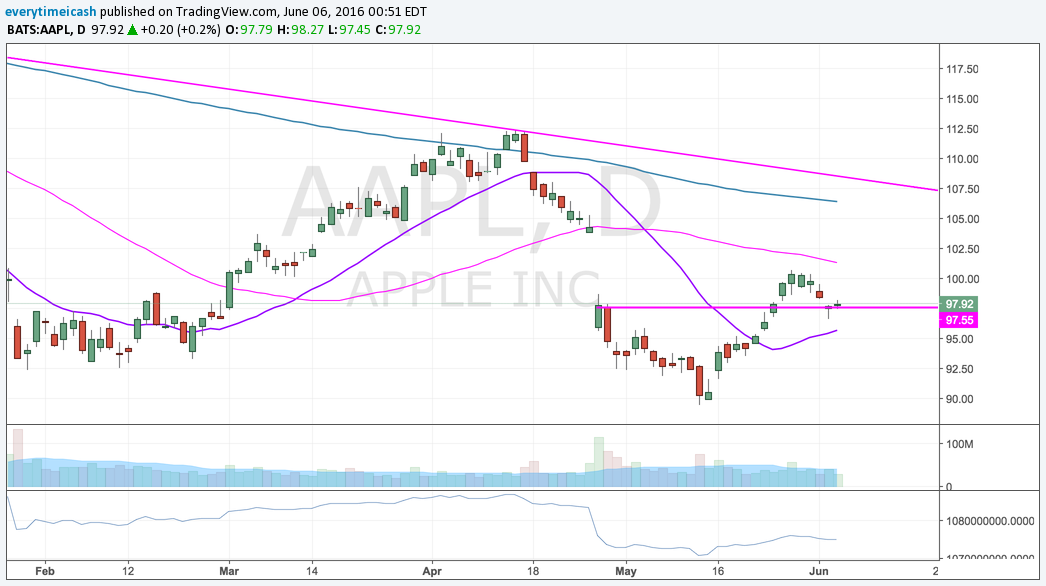
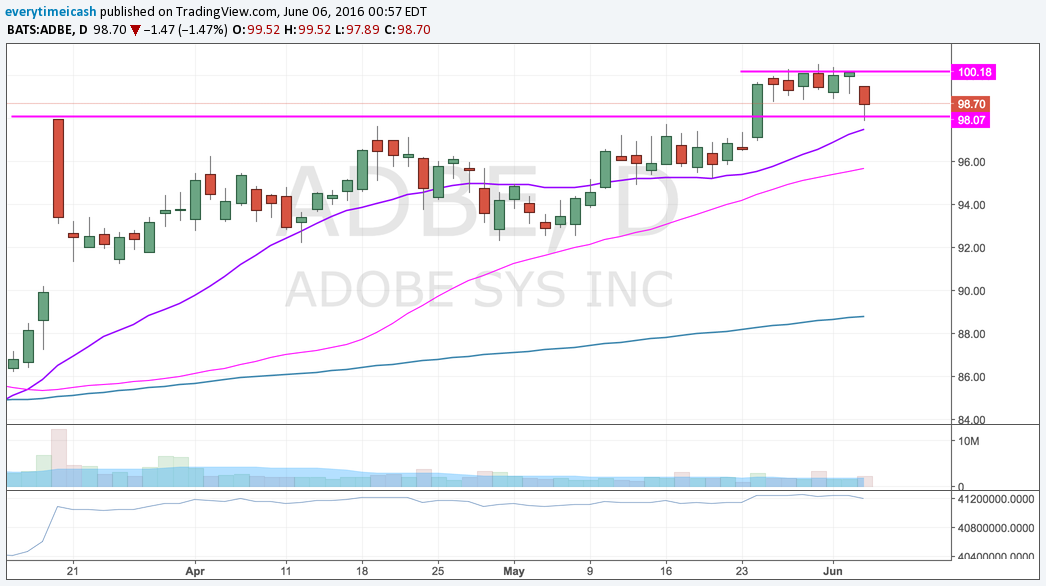
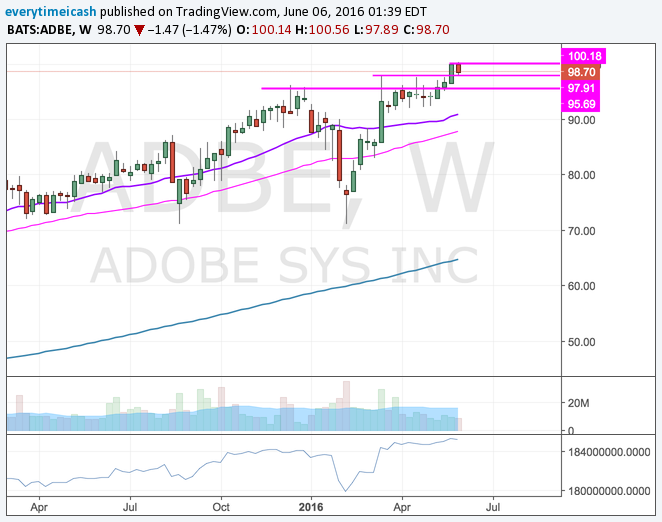
Support retest held. This should be a long so long as this holds. Rising MA's should push this higher moving forward. 100.30 is the breakout.
Heavy short interest, zero debt, channel break, and now an issued buyback. This should catch gas to the flames soon and continue its way higher. Read this post if you are interested in swinging this name and/or want more details.
This name is itching for a breakout. Here is your level.
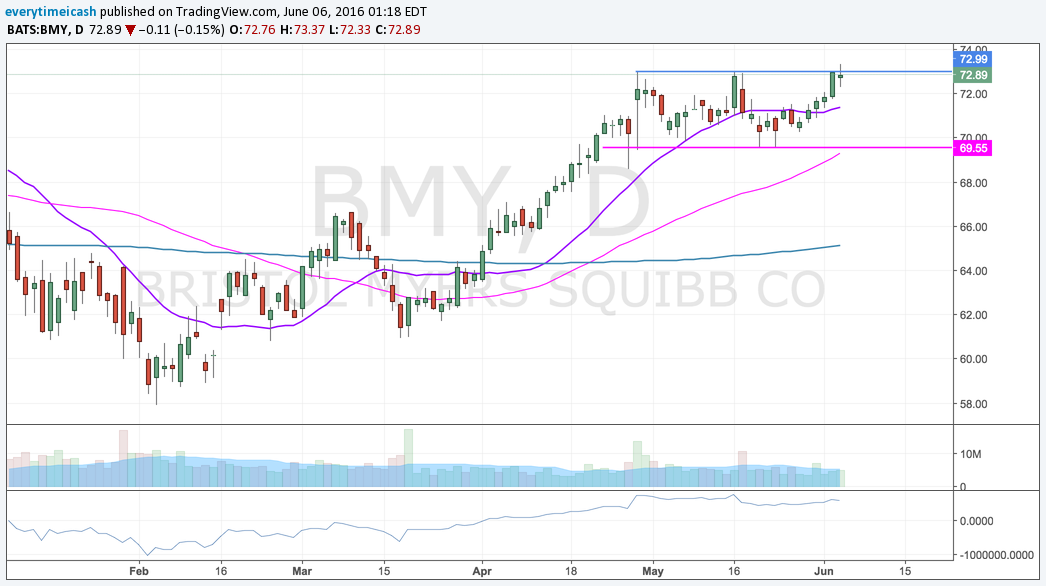
Flagging with 112 as support. Look for continuation.
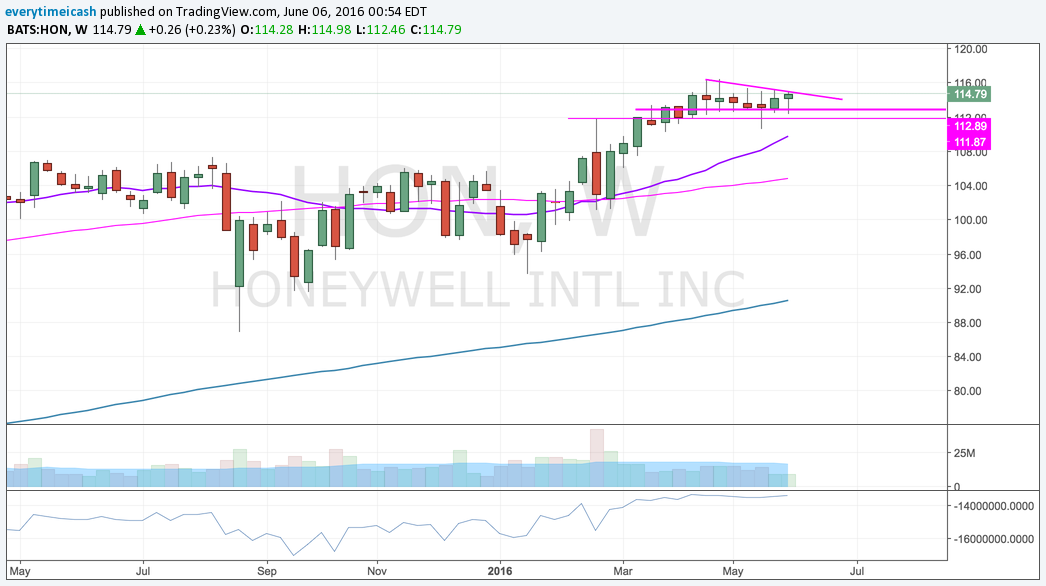
Backtest of the breakout. Ready to rip again.
Strongest sector on the board at the moment. After months of consolidation, this sector is set to go. This one may get extended quickly so tread lightly.
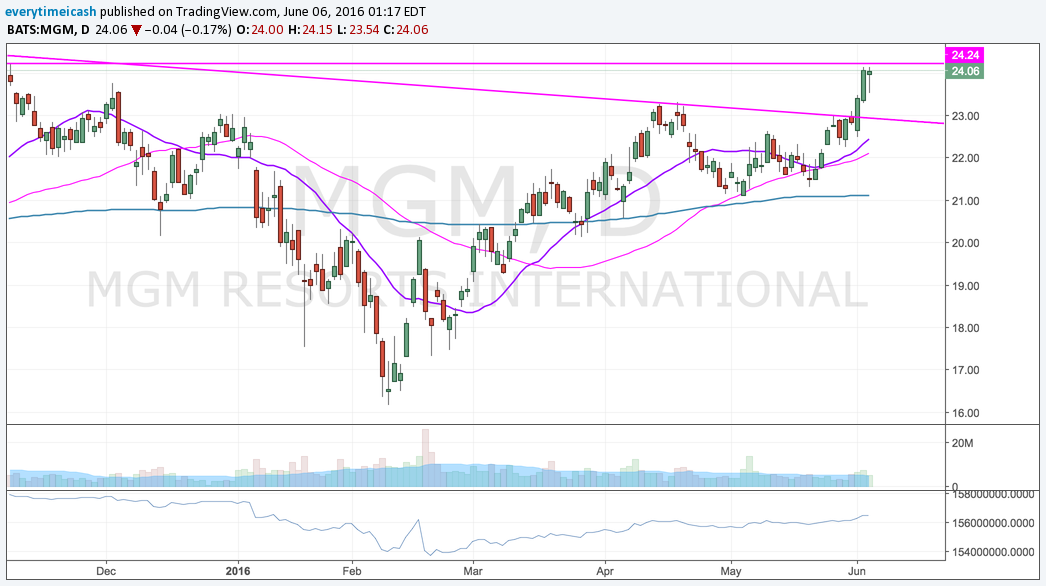
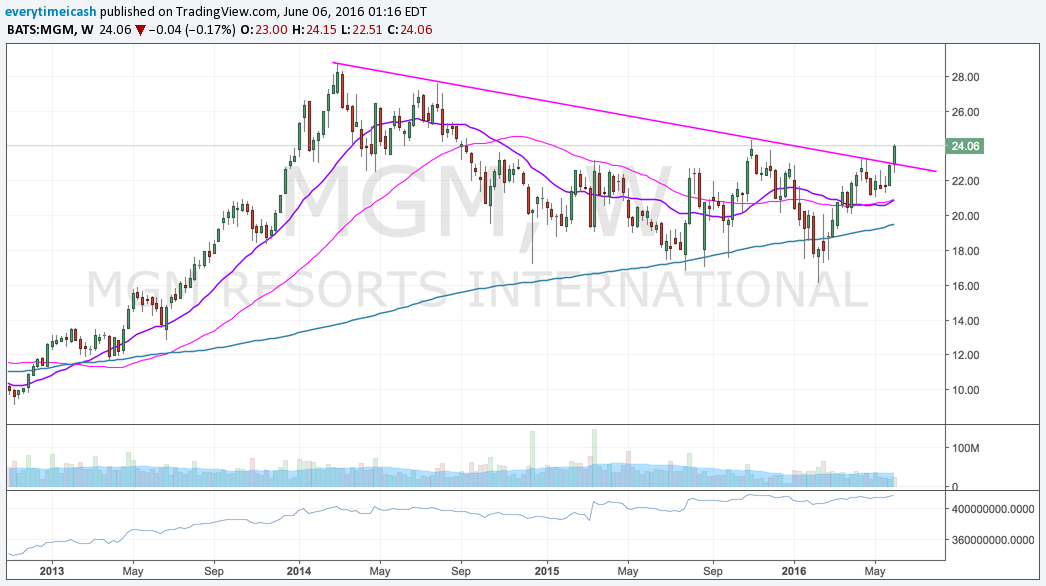
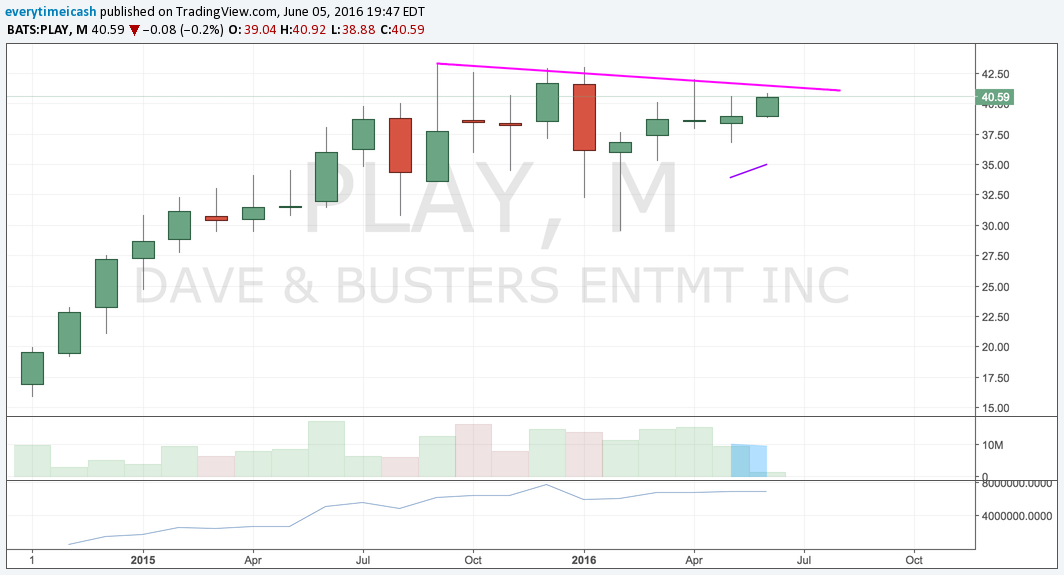
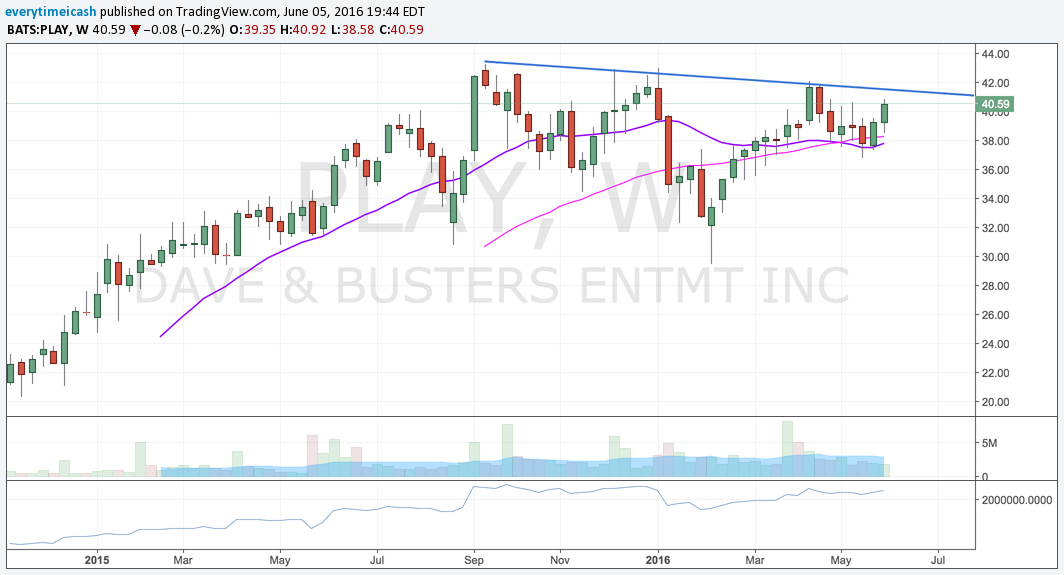
Broke out of multi-month downtrend. Add it to your bullish list. Lowest Macau exposure of all the casinos. 24.35 will lead to further upside.
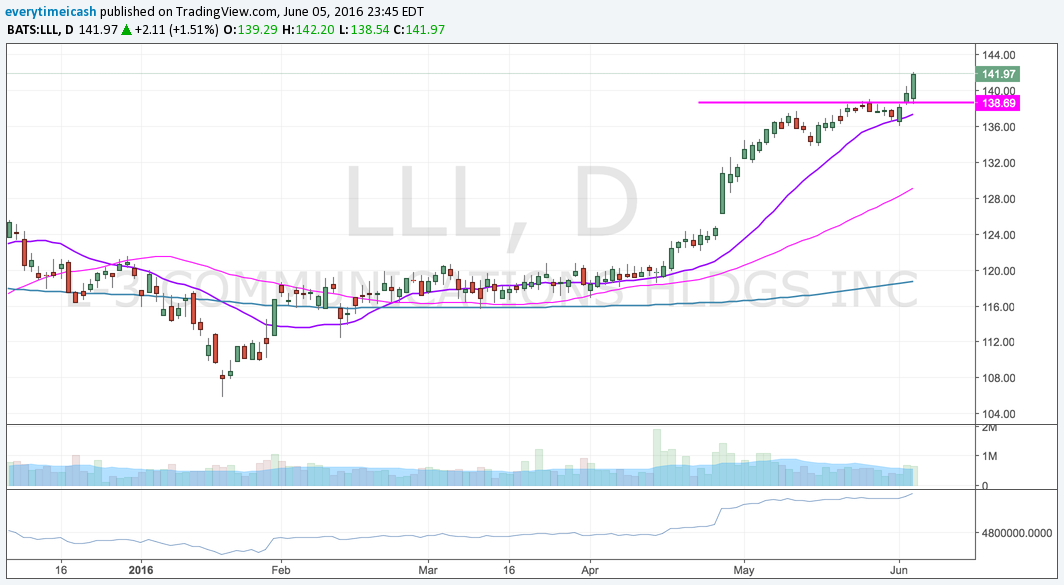
Clear downtrend about to break on all time frames. Extremely bullish chase if that occurs.
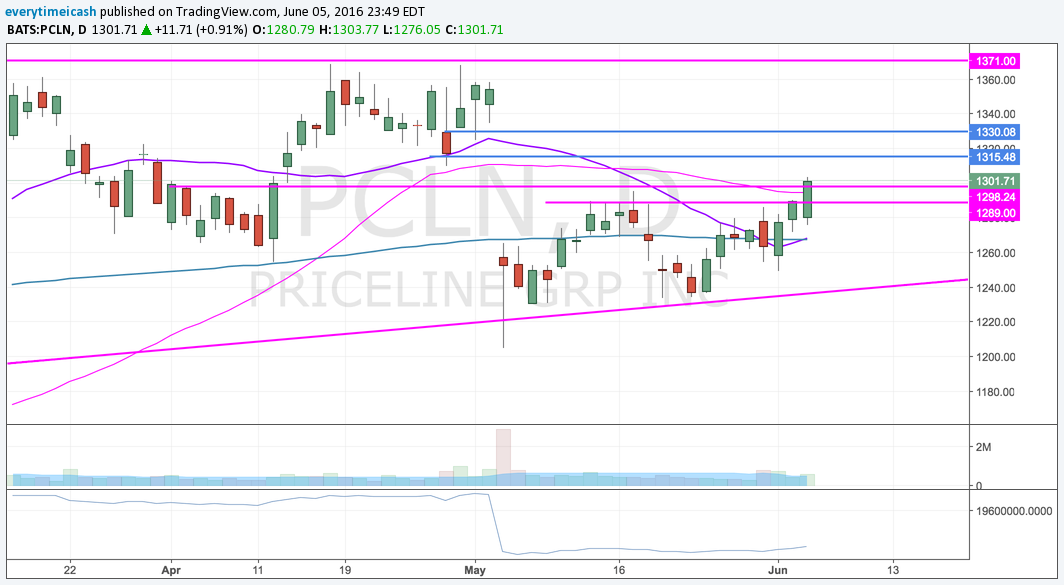
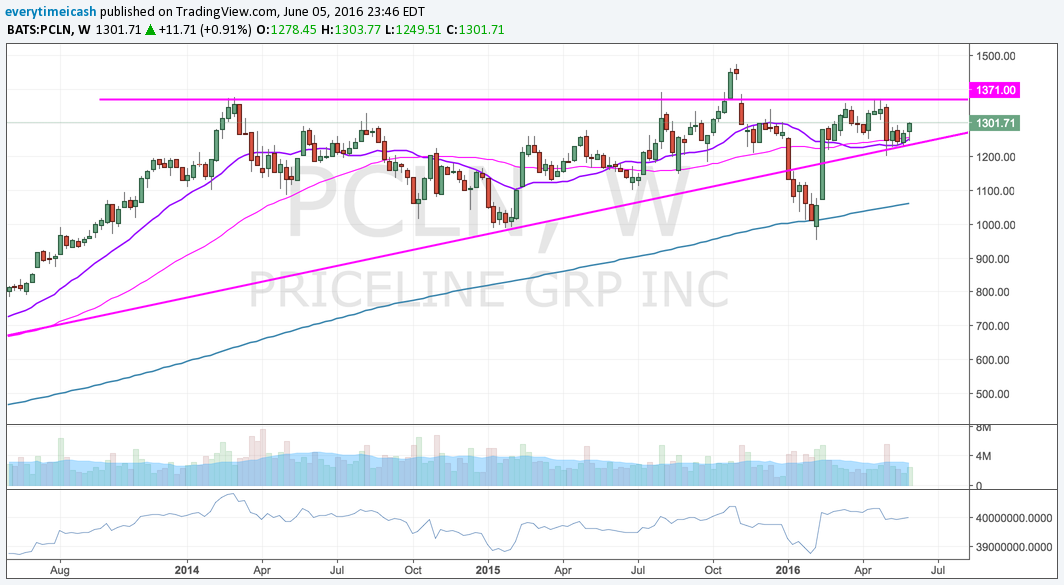
Faked a breakdown and took off. It has been in an uptrend ever since. If this plays like the market has been of late it's poised to fill the gap into the 1317 1331, and 1340 levels and possibly beyond.
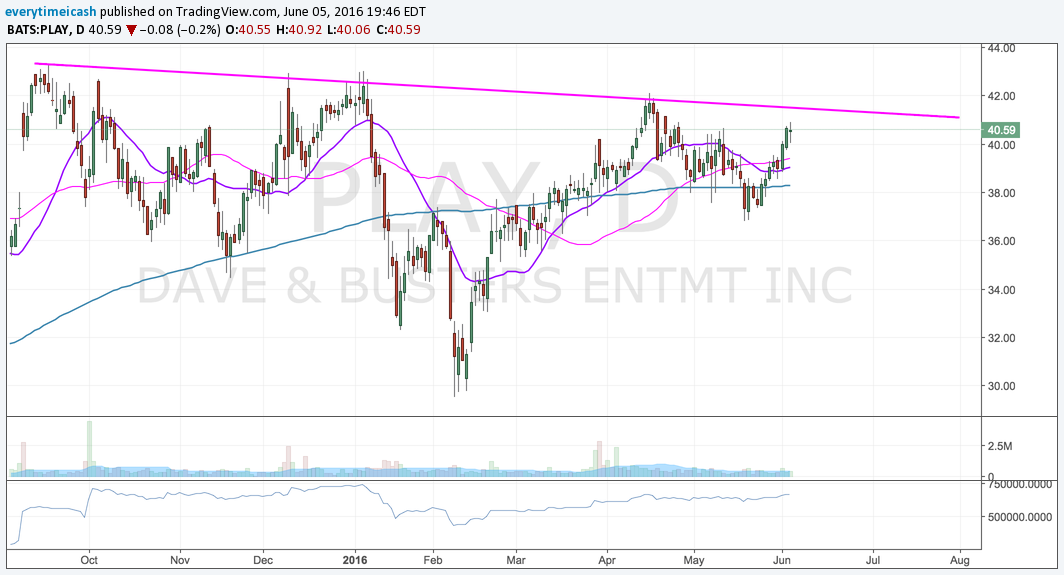
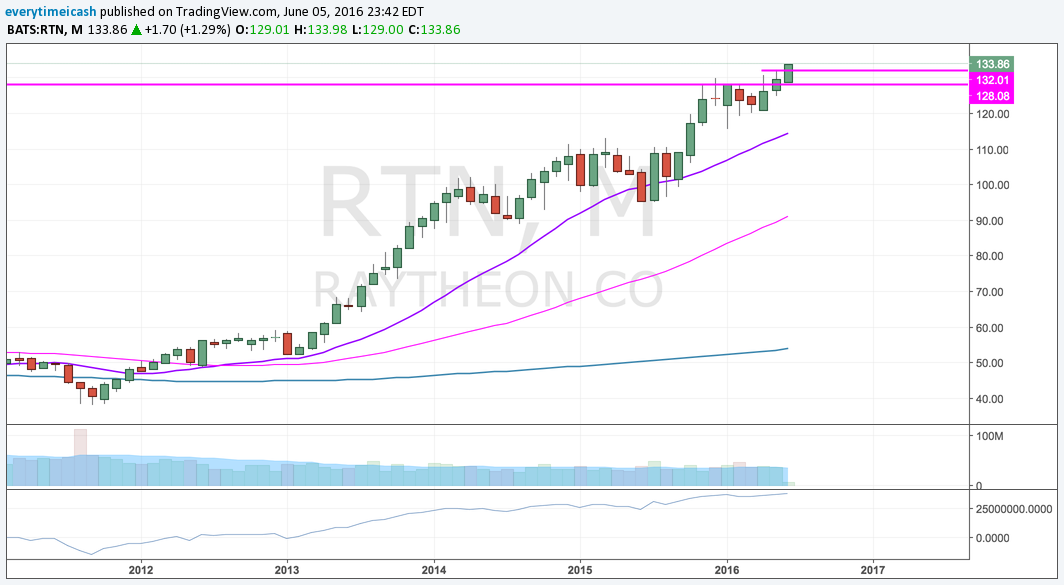
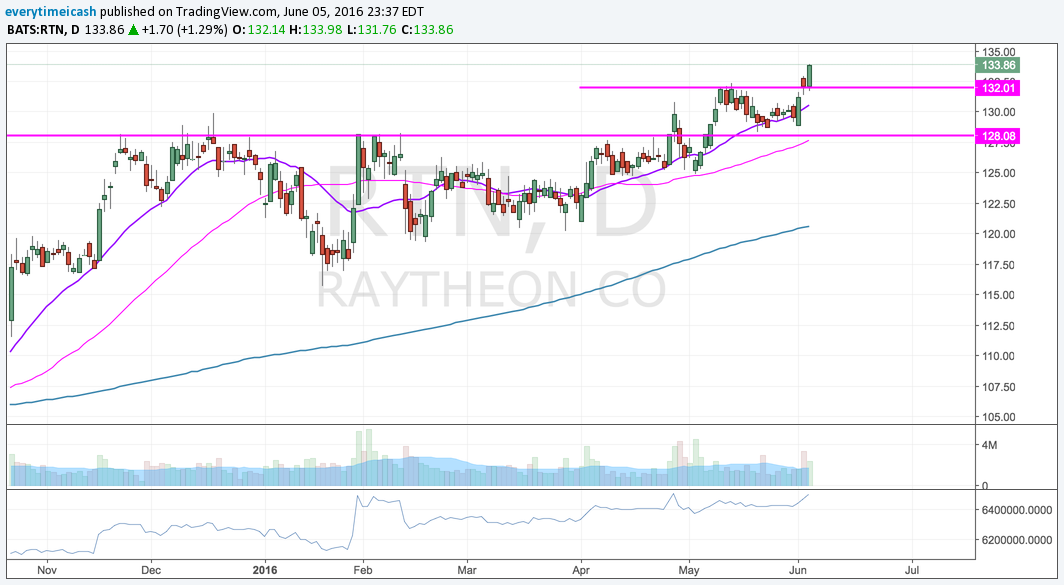
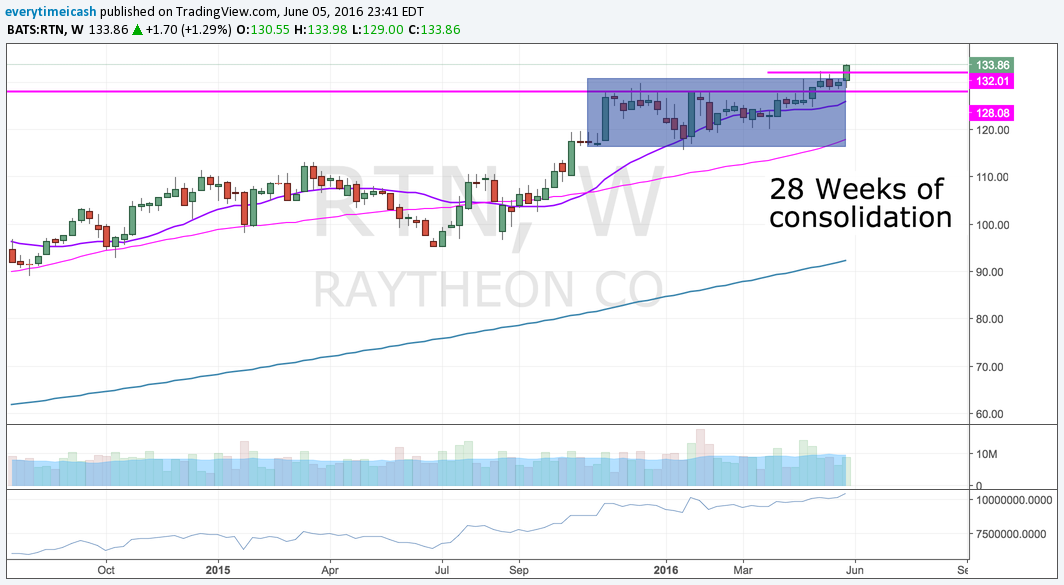
One of the strongest names in the strongest group. This had 28 weeks of consolidation. Look for a continued breakout.
Still ready.