The exception to the bright green market today was the financial sector (-0.5%).
Wolf's Den
Viewing entries in
Basics
The exception to the bright green market today was the financial sector (-0.5%).
2018 was a “difficult” year for most investors.
Whether you’re trying to make some (extra) cash or growing your account there will almost always come a period of time where you want to take on a little risk to accelerate those profits.
With options, this risk comes in the form of leverage. On opex (options expiration) this leverage is further compounded as you get the opportunity to own ever more leverage for less premium. This premium doesn’t come without a price. More often than not this premium expires worthless and you wonder why you even bothered.
There are those times where you are blessed by the fortune gods and granted an opportunity to make serious bang for your buck. This typically occurs when the confluence of Friday expiration meets a catalyst that provides you an opportunity to leverage wonderfully for sizable returns.
Personally, my first experience with “Friday Lottos” occurred nearly five years ago when the stock ripped nearly five percent to close out a Friday. I was a member of a chat at the time and “made my name” that day by turning ~$250 into north of $15,000 in just over 45 minutes. I’ll admit, I didn’t truly know what I was doing back then and the probability of what I was doing coming to fruition was infinitesimal. In fact if memory serves me correctly, I believe I bought a strike $1 farther out of the money than I should have and could have made more by buying the closer strike.
Since those days, I’ve had my fair share of trials and failures alike. Mostly failures. That said, I’ve learned that when opportunity presents itself alongside a catalyst it is typically worth the risk to try your luck so long as you are only risking an amount that you are willing to lose.
I’d like to take a moment to show the above in action and show three (successful) scenarios when buying yourself some leveraged lottos would have resulted into significant returns.
Before I dive into the details, I want to stress these types of trades are complete risk trades. For all intents and purposes these trades are lottery tickets. You don’t want to put real capital to use and you don’t want these types of trades to be the primary types of trades you take in your account. These trades should account for a small portion of your overall trading and should not be anywhere near the bulk of your trading. Secondly, I want to stress that taking many trades like this will most likely results in real losses. Lottos are only lottos when they are a small percentage of your overall trades and account. The moment you start taking lottos more frequently than you should is the moment that you will start to suffer real losses.
The most effective use of a lotto comes when there is a catalyst behind it. Without a catalyst the odds of profiting go down significantly.
The first scenario I want to highlight is a derivative lotto. This is when a competitor company/stock issues some news that has a material impact on itself and other stocks/competitors. In this case, I’d like to highlight the AMD backlash after the INTC headlines that broke on Friday.
On Friday morning, INTC issued a statement suggesting that their chip supplies are tight and that they were investing a record in capital expenditure in 2018. Specifically the comment went as follows:
"The surprising return to PC TAM growth has put pressure on our factory network. We're prioritizing the production of Intel Xeon and Intel Core processors so that collectively we can serve the high-performance segments of the market. That said, supply is undoubtedly tight, particularly at the entry-level of the PC market. We continue to believe we will have at least the supply to meet the full-year revenue outlook we announced in July ($68.5-70.5 bln vs Capital IQ consensus of $69.54 bln), which was $4.5 billion higher than our January expectations."
To address this challenge, they're taking the following actions:
"We are investing a record $15 billion in capital expenditures in 2018, up approximately $1 billion from the beginning of the year."
"We're making progress with 10nm. Yields are improving and we continue to expect volume production in 2019."
"We are taking a customer-first approach. We're working with your teams to align demand with available supply. You can expect us to stay close, listen, partner and keep you informed.
As you can imagine, this headline sparked some incredible buying in INTC stock. Shortly after 11am the stock took off like a bat out of hell and rallied nearly 2.5% in short order (pictured below).
As you can see, INTC took off shortly after the headlines broke and did not stop until it hit its major downtrend.
If you were fortunate enough to catch the headline the moment it happened, the obvious trade would have been to buy INTC that very moment. If you were like most however, you likely missed that rush to buy and the risk premium would not have been in your favor.
That said, if you’re familiar with the space and read the statement you got a little insight that gave you a pretty easy derivative trade. In the statement, INTC stated the following:
“We're making progress with 10nm. Yields are improving and we continue to expect volume production in 2019."
With that statement, the headline in INTC sparked buying across the sector with the exception of AMD which many believed had been gaining market share on INTC due to INTC’s missteps in the 10nm chips.
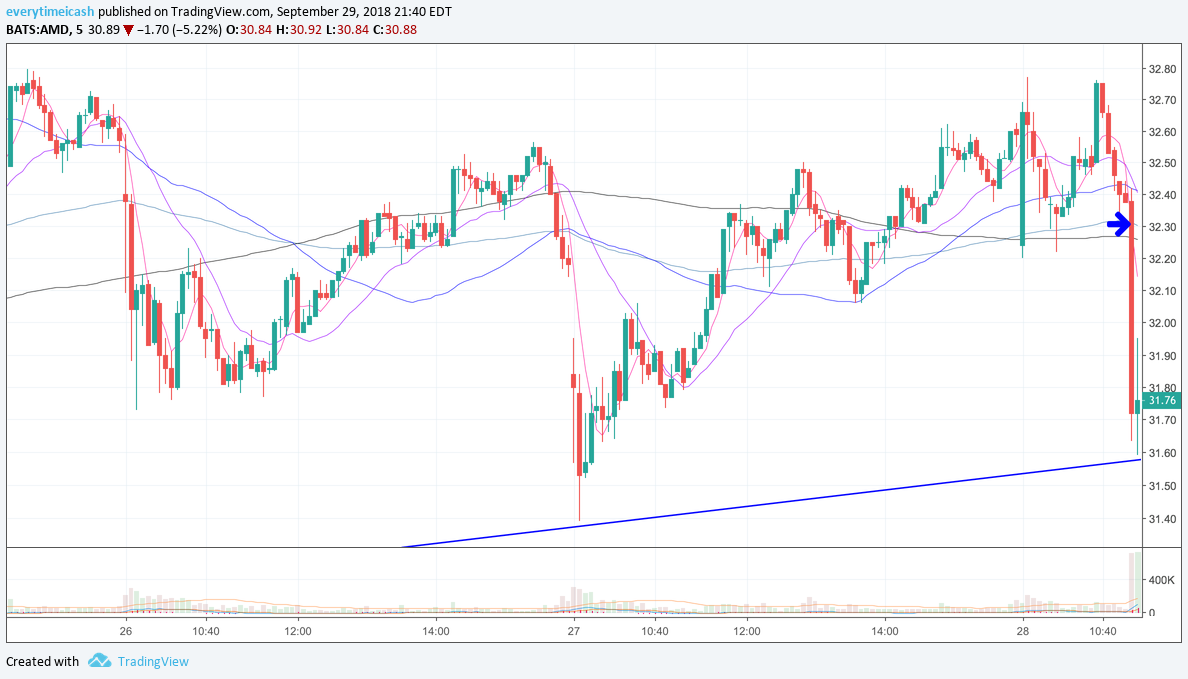
As you’d expect, AMD’s stock started to break exactly as the INTC news hit the wire. Unlike INTC though, it gave you a perfect trade setup if you knew what to look for. You didn’t have to catch the first five minute trade in order to capitalize on AMD. AMD’s stock had been stuck in a wedge since breaking higher yet again on September 12th. Upon first reaction of the headlines, AMD’s stock had found support at the bottom trend of the wedge. It continued to oscillate in an intraday bear flag for nearly 15 minutes before subsequently beginning its free fall.
Above you see the first reaction to the INTC news followed by the subsequent break of the the wedge.
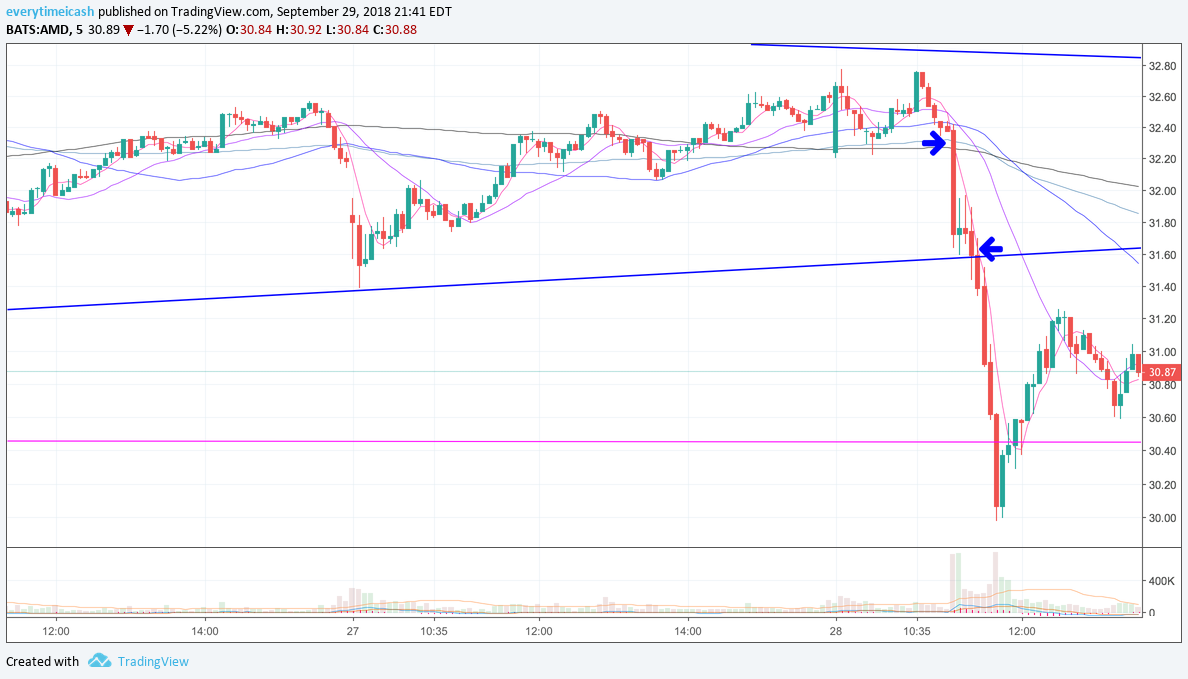
In an instance like the above, we have a very defined range, a catalyst to drive the price of the stock, and a technical breakdown that gives us an opportunity to capitalize on the confluence of events. Unlike INTC and the others, AMD gave two opportunities for capitalizing on the “bad” competitor news.
At around the time of the breakdown, AMD’s 31.5 weekly expiration puts were going for 0.12-0.17. If you felt like this was an opportune moment to take a gamble you could have (hypothetically) filled your lotto puts prior to the break down. If you wanted a little more confirmation (like I did) you could have filled the break for ~0.22-0.25.
On the break down, AMD’s next level of support set itself up at around 30.5 with round number support sitting at 30. In this example, the risk reward premium told you that if you bought lottos, you were willing to take the risk in order for these puts to potentially triple in value (if not more). Additionally, with a scenario like this, you’d know almost instantaneously if it worked out or not. In this case the trade worked and the options nearly returned 5x their original value in a matter of 10 minutes.
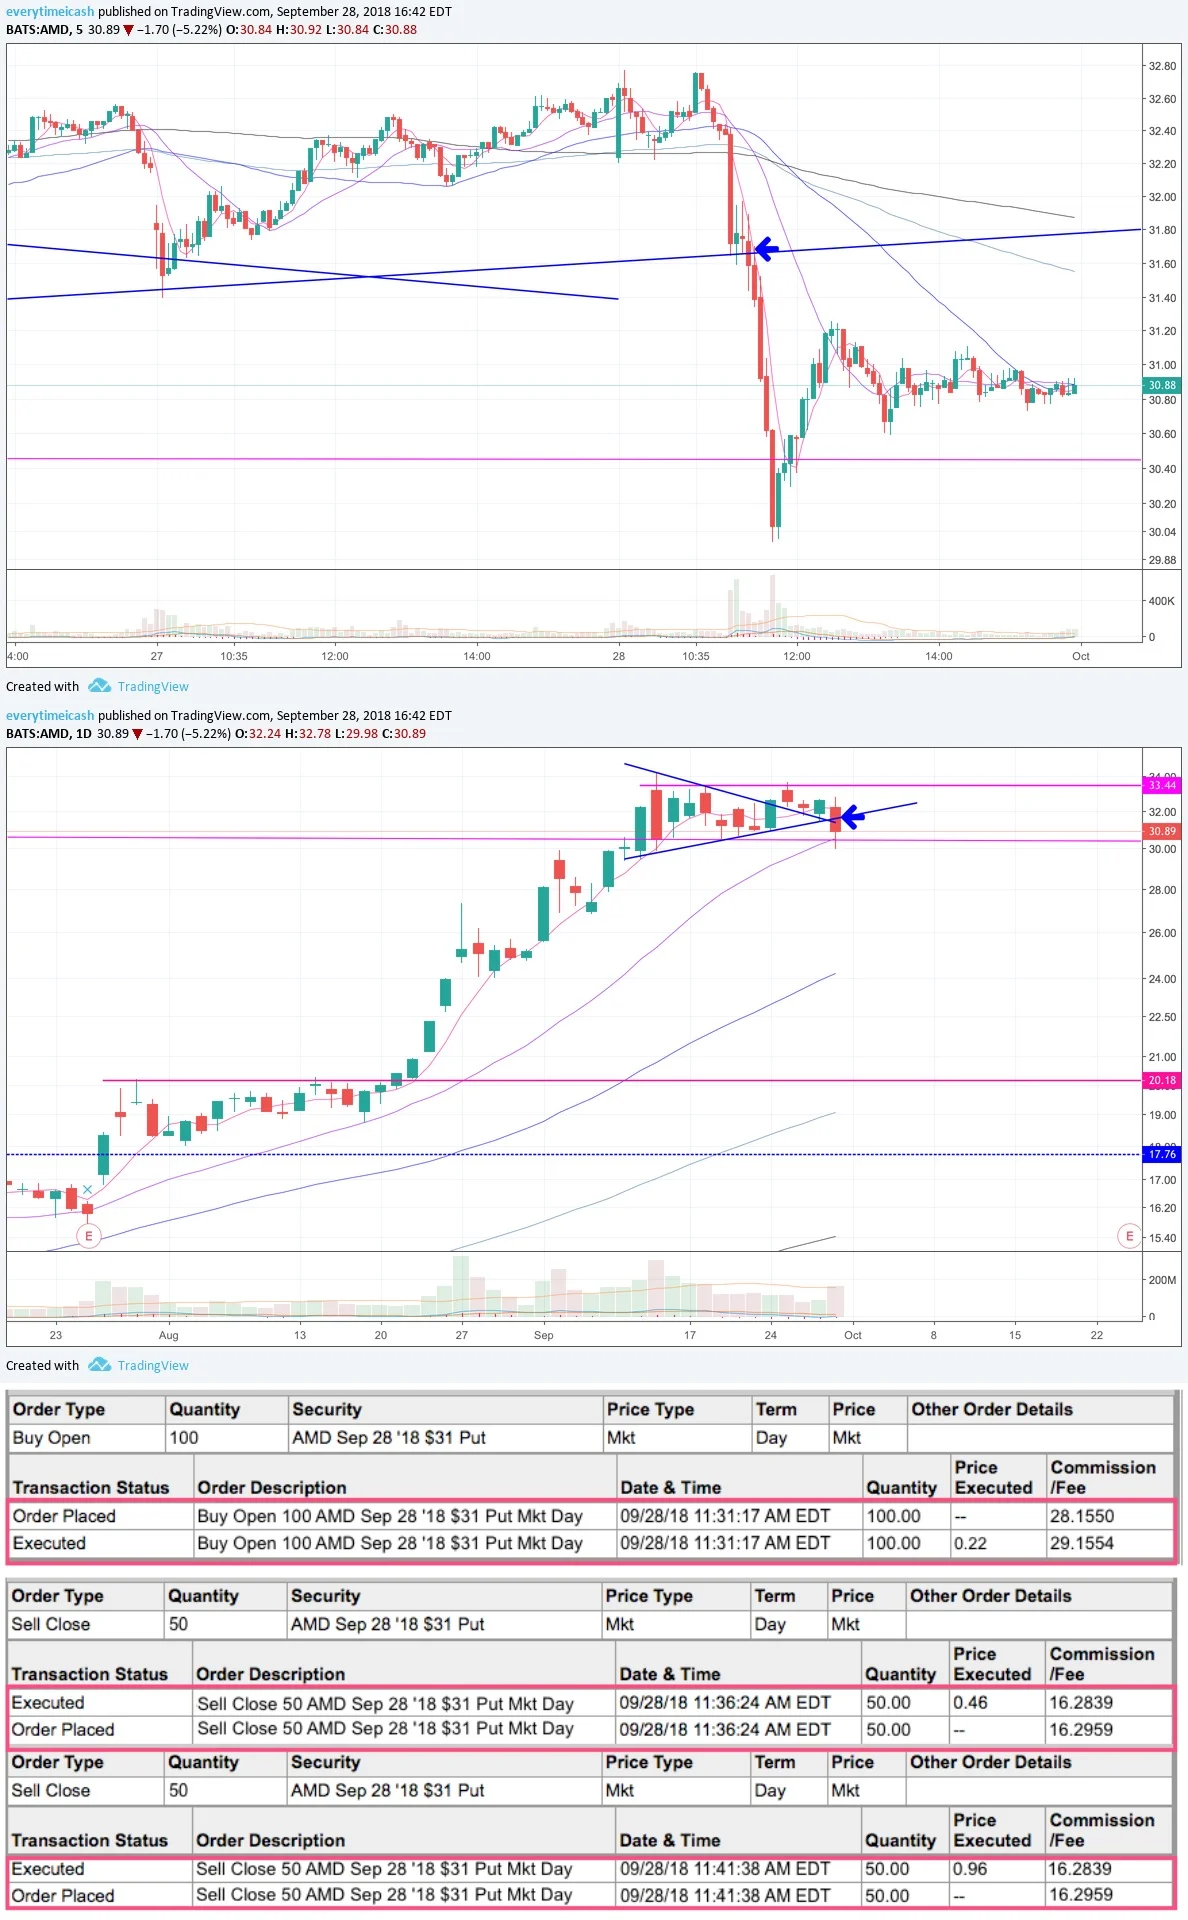
Below you’ll see the daily breakdown along with the trade that worked on AMD. You’ll notice the breakdown highlighted by the blue trend line and the blue arrow, the daily chart breakdown, and the trade netting roughly 4.5x it’s initial value in a matter of 10 minutes.
In the above, a simple $110 bet would have resulted in ~$480 when it was all said and done. Not bad for ten minutes!
In the above, we went over what a derivative trade would look like when a derivative catalyst takes precedent. Now I’ll go over what happens when you get a direct catalyst and how powerful that result can be. In this instance, I will focus on FB.
Shortly after the AMD trade we were blessed with another catalyst driven trade opportunity when FB announced that nearly 50Million users information may have been compromised.
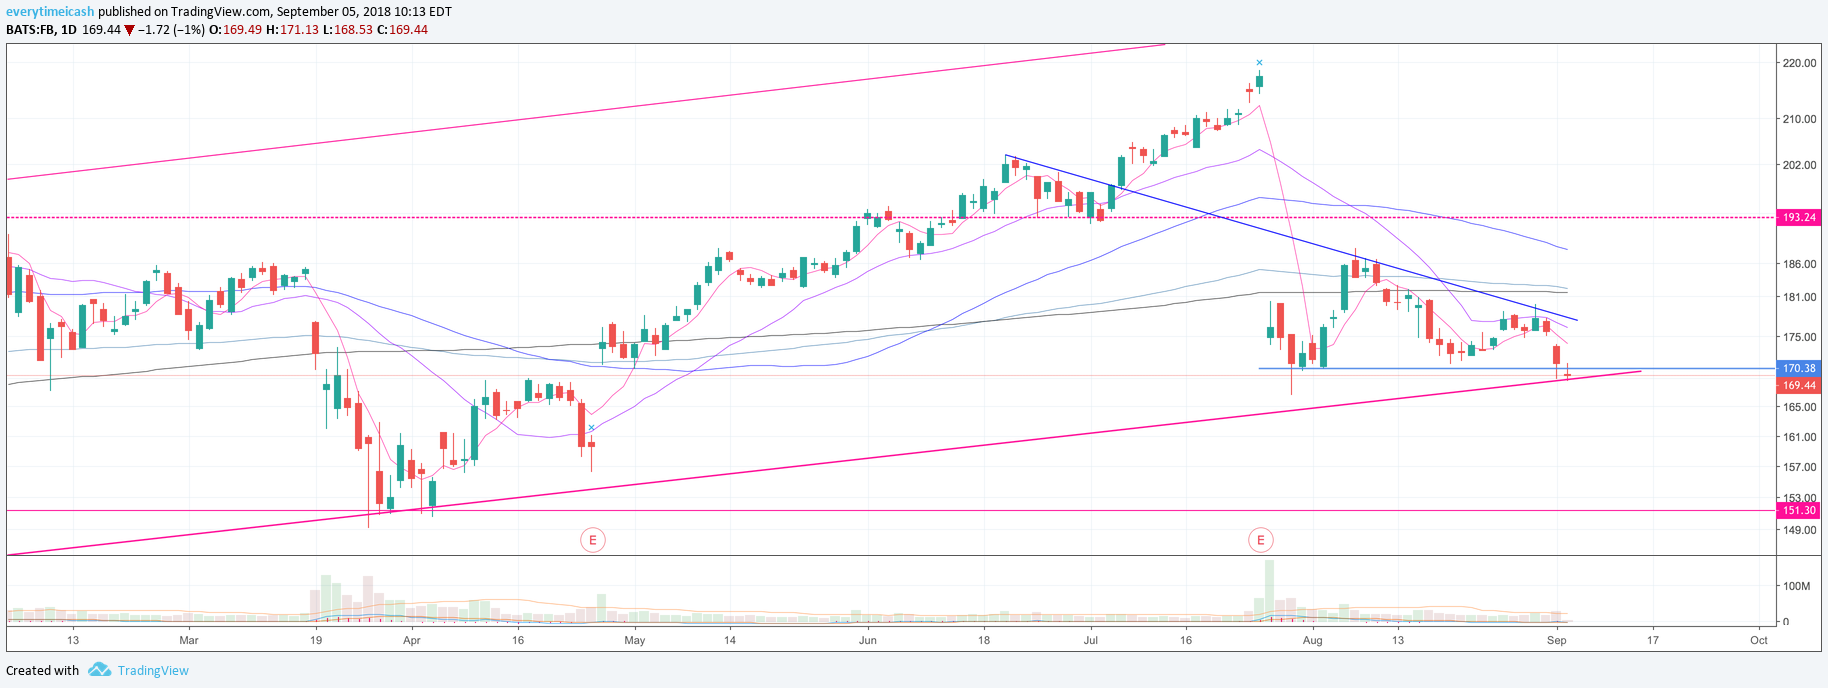
I want to point out that FB had been acting notably week all day Friday after rejecting its major trend tests the previous day. (Shown Below)

FB D
As you can see above, FB rejected its previous uptrend and the new downtrend simultaneously the previous day. As stated above, FB had been acting weak all day Friday as well. In this particular case, FB broke its ORB range shortly prior to the headline and presented an opportunity to take a short position. In our case, we took flyer lottos on the 165 strike prior to the announcement specifically to try and capture any further downside after the range had broken. Again, in the case of lottos, you are to risk what you are willing to lose and no more. Approximately 15 minutes later FB announced that their data had been compromised providing further opportunity to leverage the trade. (See Below)
Since FB has been a “weak” stock since their disastrous earnings report it has been in “shoot first, ask questions later” mode. With yet another downside catalyst, the stock presented further opportunity to leverage positions and potentially give further downside. As is often the case with stocks, when selling takes hold they usually take the elevator down. In the case of FB the drop was precipitous. In a matter of five minutes, puts that were worth a quarter were north of $2. Next week puts that were going for <$1 had more than doubled. On the catalyst break, we leveraged our positions and added to our puts and were fortunate enough to profit extensively. The blue arrow below signifies where the leveraging took place.
As you can see, I was able to leverage my small put position and turn it into a sizable lotto that resulted in nearly 10x in a matter of four minutes.
The last setup I want to cover is pretty basic. After a catalyst drives a stock up or down a range will be set. When the catalyst is after hours the same rules will apply. So during market hours it is important to take note of both ranges. The first range being the range that occurs during market hours and the second being the range from the premarket.
Once one range is broken, it will typically create enough room to test the other range (assuming that second/premarket range is higher or lower than the intraday range). Once the premarket range is snapped further room to the upside/downside is generated (depending on the direction of the break). This sounds complicated, but it’s really kind of simple. On Fridays i like to draw out my support/resistance lines and account for premarket ranges. I especially like doing this after a catalyst occurs.
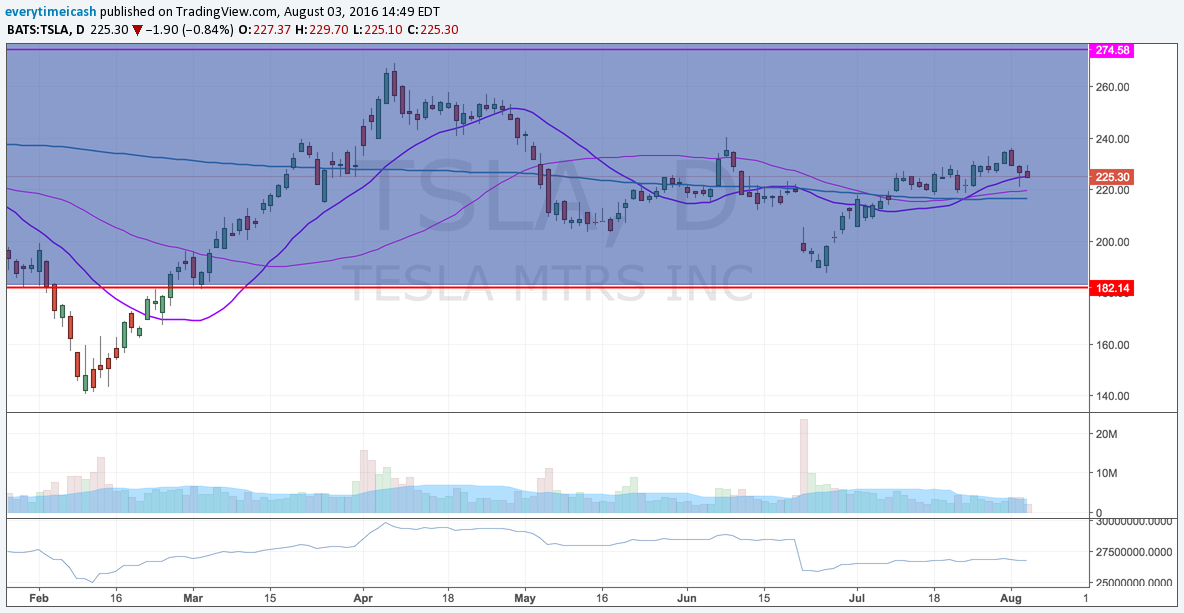
Let’s take a look at the above in action with the help of TSLA. On Thursday afternoon, the SEC charged Elon Musk with Fraud and the headlines sent the stock into a spiral. TSLA closed north of 300 on Thursday plunged to a low of 265 prior to bouncing around. In its fall the stock broke a multiyear uptrend. (Pictured below)
TSLA D Broke
To start the day, TSLA rallied off the open and made a few attempts at reclaiming its multiyear trend line. As the day went on and the stock failed to reclaim the line it was important to note the daily ORB low and the premarket levels. To start, you could have bet against the 275 level with the notion that the stock would continue to reject the trend line and that would have been a safe idea. Secondarily, and more easily, you could have waited for the days lows to break and understood using the premarket lows (265) would be tested and in the event of the premarket lows breaking you would have further downside.
In our case the second of the two is how we played TSLA. We simply waited for the daily low to be broken and took our bet understanding that 265 would be our next level of interest. A breakdown of that level would potentially result in a 260 test. Fortunately for us, that is exactly how it played out.
As you can see from the above pictures, A break of the premarket lows of 265 accelerated the stocks flush (highlighted by the blue arrow). You can also see the stock rejecting the previous trend on the daily. Finally you see the logic in advance of the move. The break of 265 flushed the dip buyers and gave an opportunity to nearly triple your money quickly. If you’d front ran the 265 break and simply entered on the ORB breakdown you would have been able to collect nearly six times your money.
I want to stress one last time that though these trades did work out that is typically not the case. That said, it’s important to know your levels and understand when it is prudent to place bets such as these as they can be a great way to grow your account quickly. It is also equally important to note when that sort of trade is not appropriate. For example, if I am down to my max loss threshold on the day or close to it, I don’t typically want my final trade(s) to be lotto trades. Using this type of common sense and understanding the situations presented can go a long way to help you grow your funds.
If you'd like to follow my trades in real time click the "Join Now" button at the bottom of the page. For those that will and have asked, use the code GUEST on checkout for a discount on your first month with no commitment thereafter.
Some of the most powerful setups and the quickest moves in the markets come from when sentiment just goes from really terribly bad to just bad.
The internet, specifically FinTwit, is full of charlatans and snake oil salesmen telling you that their magical tricks will get you to your wildest dreams. The reality is most are average at best and don't espouse any real tangible knowledge or give you an edge. So it is because of this, and because when markets get rocky my inbox blows up, that I wanted to take a moment and give my personal insight on the most common question I get asked.
As someone who has been trading transparently for three years now I often hear the same questions. No question is more prevalent however than "How do I know how much to put on a trade?"
As a part of my "service" we offer individuals a spreadsheet that gives them an idea of what their overall risk tolerance should be dependent on their trade size. The spreadsheet also works in reverse. This is predominantly "basic math" but let's just go over it quickly. For example, if I am okay with losing $250 on a position and the options price is going for $1.00 my position sizing/risk tolerance will be the following according to my parameters set above:
Obviously, the larger the position size the more you have to "thread the needle" for that position.
The second most common question I get:
Absent of allegations of fraud or takeover noise, there is no "sure fire" way to tell just how far a stock can go both up or down. There are however tools/edges at your disposal to give you a sense of when you can/should leverage or when you can expect the potential for an outsized move. Notice I said "potential" in the above sentence. At the end of the day regardless of expectations or rationale, the market is irrational, and more often than not that is costly to your bottom line.
In simple terms, your options should be how far you perceive the move in question will in fact travel. Take into account that you want to be reasonable with your assessment and try keep your price objective within the measured move of the stock.
With the above diatribe over with, I want to share an example the above in action. Specifically how you can leverage father out of the money on major breaks (up or down) to get outsized returns on your capital. For the purposes of this exercise I want to highlight Facebook (FB).
There are particular times when it is prudent to take stabs at exaggerative moves in the market. Though every trend book will tell you buy the breakouts and sell the breakdowns and you'll make money easily, that is not always the case. There are some key factors that can help you with your decision making process. Specifically I've found the following three items to consider prior to taking a potential trade.
The first item I consider when taking a trade is the overall market. The questions being, what is the stock market currently doing? How is it preforming relative to the position I want to enter?
Put in layman's terms; do I want to short or go long? Is the overall market suggesting I should short or go long?
If you think of stocks as boats and the overall market as the river they flow on, you predominantly want to be in a boat attempting to go with the tide.
Since 70% of stocks tend to move with the overall market trying to move in the opposite direction is not prudent for your overall success. If I can put this scenario in a blunt image for you, don't be the stray gazelle in the Serengeti. We all know how that ends.

Don't Get Slaughtered
When taking a position, it is important to take note of if there is a catalyst at play for your move. Though not always necessary, if there is a catalyst, it does bolster the chances of our thesis coming to fruition. If we're using the boat analogy from above, a little wind in the direction you're going definitely gets your sailboat moving more quickly. Conversely, if there is an opposing catalyst, your chances for may be impeded.
This one is quite simple. Is there a particular trend for your stock? Or is it just dead money? It is more likely for your position to be accurate if you are trading either with the trend or when the trend breaks.
If you are trying to go long a stock, more often than not, staying with the uptrend for that stock will be beneficial for your overall success. That is of course unless the overall trend breaks. In that particular case trying for the opposite could prove to provide more bang for your buck.
As a general rule, the longer a trend the harder it is to break. Secondly, most trends don't break on their first attempt, but rather after multiple attempts at breaking.
I want to give an overall picture of the above in action. For this I will focus my attention on this week's FB trade. Going into the week FB had not traded particularly well as it finished August below its major MA's without the ability of breaking out.

FB Daily
As the above shows, Facebook was unable to break above a downtrend set prior to its blowoff top prior to earnings.
This next image shows how FB had been holding 170 as support after it's earnings report.
FB 170 support
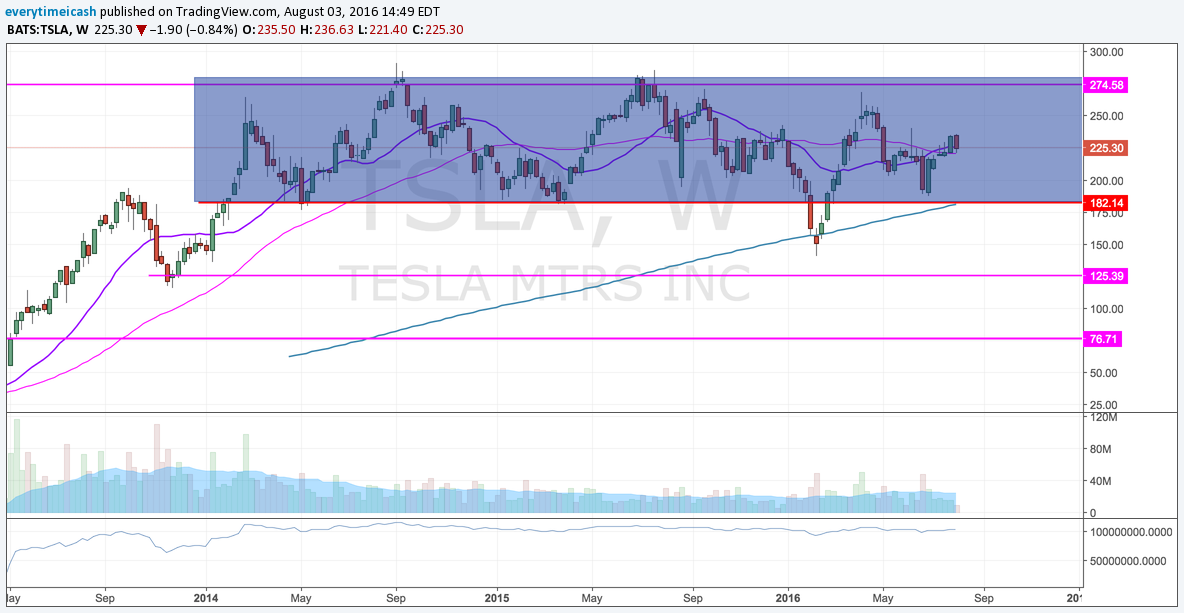
With the above in consideration, let's zoom out and consider any long term trends for FB.

FB Weekly
Taking a look at the above, we notice that FB has been in a 4 year channel from April 2014. Like clockwork, the buys have come in on the bottom and the sells on the top. This channel was defended recently as well following a disastrous earnings report. That being said, FB had been acting weak and they were slated to present in front of congress again. The overall market wasn't helping either, as buyers abandoned ship yesterday seemingly being topped out by the AMZN $1T rejection one day prior.
As the above was taking place we began stalking FB in the chat yesterday. I first highlighted it around 10am EST and gave the chart for the wedge it had formed and the long term trend. I then followed it up with an alert, taking the out of the money weekly 165P's as the stock hung precariously on the edge. Since the trend line in question is a four year trend line, I found it appropriate to leverage with farther out of the money puts in this case. Though this is how I chose to take my first attempt at this trade, this is not a practice that I encourage typically. More often than not, being too far out of the money will result in you wasting your money.
This position ended up working out for us immediately once the 170 level broke as the stock careened into 167.5 before finding some floor with the overall market. Unfortunately however, the stock did in fact find a floor and I was stopped out of a majority of my original position as it started to rebound. The stock started to form a new range between 167.5 and 169. It was important to make not of the breakdown level from that point on to decide whether or not to re-enter a position into the close. Secondly, it was important to note as a break of the lows would create further selling pressure. As the stock broke the intraday lows it was prudent to reapply my short of the stock; and thats exactly what we did.
With the stock selling into the close and breaking a multiyear trend, I found it prudent to put on an overnight position for the hopes of further selling and I'd make note of the previous days lows to get more aggressive with the stock should those lows continue to break. (highlighted below)
FB would be back on the top of my watch list yet again today. Within minutes, the overnight put position was in my favor and I could rest easy and raise my stops. From that point on, I made note of the previous day's close and the opening range lows as another catalyst point for selling as shown below.


The stock attempted to find a floor in the first half hour and subsequently attempted a run at the days opening price. A failure of that price suggested that any break below the opening range would result ini further downside. This was a safe bet as the stock had already broken a multiyear trend and closed on the lows just one day prior. With that in mind, and with a breakdown of the ORB I found it prudent to get more aggressive. I raised my stops on the overnight position again and added more puts (highlighted by the arrow below).
As you'll notice, once the position was on, the stock never recovered. It continued its escalator down until it came close to the 160 round number. By that time, we were all out of our puts and had rolled down our winners.
As a rule of thumb, I like to sell ~50% my winners once I see a 2x return. This allows me to avoid micromanaging the position and allows me to let it run its course to completion. All in all this trade worked out and was quite lucrative.

Some of the FB profits
I opted to write this post primarily for two reasons: first, because I thought I'd finally put some of the "rules" I follow in writing to help answer some of the recurring questions I see/hear. Secondly, as I stated above, during times of market volatility my inbox blows up. This is an easy way to address all the common concerns and questions in one swoop. If you found this post helpful, please like and share it. If you'd like to learn more about how we trade feel free to reach out to me using the contact link on my website. As I stated, more and more people contact me during volatility. It is important to state, not all markets behave the same and this is not some cookie cutter method.
If you'd like to follow my trades in real time click the "Join Now" button at the bottom of the page. For those that will and have asked, in honor of my birthday I am giving anyone who signs up a discount to start. Just use the code GUEST on checkout.
Disney (DIS) will report second quarter earnings this afternoon.
Starbucks (SBUX) will report Q2 earnings this afternoon (16:05 last quarter) with a conference call to follow at 4:30 PM ET
“A prudent speculator never argues with the tape. Markets are never wrong, opinions often are.”
I made a comment during the midst of all this recent market "madness" that if your favorite "Market Guru"/"Trader" was something like a personal trainer 15 months ago, you should probably reevaluate who you are following. Though, in part, I did it for the joke the underlying theme remains.
As the cliche goes, "a rising tide lifts all boats." For the last 16 months we've all been "privileged" to see all sorts of rafts get lifted. Between the stock market and crypto nerds everyone everywhere has become an "overnight success" and more importantly a "guru."
I want to start this post by emphasizing that I in no way shape or form consider myself a "guru." In fact, I abhor the term. I find it to be lazy, self-congratulatory, and most importantly just plain ignorant. During my 13 year trading career, I've found the most effective way to trade any market condition is to approach trading with a "risk management" point of view. If you know what you are willing to lose before you enter a trade along with the most you're willing to lose in a day/week/month/quarter/year, you can survive in this game. Secondarily, I want to stress, it's okay to be wrong. It's also okay to not know what's going on. The sidelines are your friend and cash is in fact a position. If you are able to avoid large drawdowns (for the most part) you will survive.
During the last 16 months traders, investors, and pretenders alike have been rewarded handsomely for buying nearly any dip in nearly any asset class. The recent narrative will tell you that investors have been making a killing by selling the VXX/VIX and puts while buying dips in assets. This compression has suppressed volatility and has kept the steady stair step higher going. During that same time, a resurgence of "Andy Zaky's" has emerged. Dudes that were once driving for Uber, working as personal trainers, school teachers, and even police officers were minted into "experts" over night.
If you are not familiar, Andy Zaky is a "former AAPL wonder-kid" with no formal training of any kind. The quick back story goes something like this; Zaky was an AAPL fan boy during it's original meteoric rise who started writing about the issue who lost nearly $10,000,000 for investors around 2012.
Zaky grew his notoriety as he AAPL's stock rose early on. As he ramped up his price targets his "genius" inflated along with the stock price. However, like most "gurus", as the stock eventually waned and broke trend, so did his genius. Sadly, he cost investors millions as he pumped more and more money into more and more calls that subsequently ended up worthless.
That's usually how it goes for most people, and specifically, most "gurus". As markets are in bull mode, 70% of all stocks are tied directly to the overall index. When individuals are able to identify the leaders in this bull market scenario, they are able to enhance their reputation simply by consistently announcing "BTFD" at any major support trend. As the rally continues, they are made to look like superstars.
Unfortunately for them however, this sheepish behavior destroys winnings significantly faster as markets start to turn. As evidenced by this week, more often than not, the decays happen suddenly and without warning. "Traders" that have been conditioned to buy dips get buried quickly as support levels crumble while large institutional investors look to lock in their profits. These "traders" they find themselves struggling to get a grip of the madness that is about to bestow upon them.
We saw this dynamic play out during the last year. Dips were swallowed by dip buyers as the VIX was choked down. Every dip was bought and every Tom, Dick, and Harry was a newly found "expert" in trend analysis and stock trading. This phenomenon was on display in full effect during the Bitcoin mania. Every other idiot I encountered was quitting their day job to "trade cryptos" while they told me how THIS is going to be how they make a fortune. Fewer than 10% of them however (yes I fact checked my sample) even knew a damn thing about the crypto market (outside of the term bitcoin) before things already went into parabolic mode.
As reality came crashing back down, so did those profits. Every "boy genius" that was telling you "Bitcoin to $13000!" on the way up was getting awfully quiet, or worse, louder. Now they're coming to terms that they can't pay their bills in cryptos and the catch 22 that we were telling them about as things were going up is still very real:
"You're making claims that this new 'currency' will replace the currency you need to actually use in reality. You need to cash out to be able to realize your gains. You also need cash to drive the price of cryptos higher."
Unfortunately for most who got into the game late, they're f'd. Cryptos are hanging by a thread and in a downtrend. This is still without the downward momentum kicking in.
I dont bring this up to bash anyone who loves cryptos. In fact I think their utility will in fact change the world. I only bring this up to draw on a more important point.
If we use the Bitcoin phenomenon as a primary example, everyone, and I mean everyone, was making boatloads of cash on the way up. Everyone was telling you how great they were at picking "the next hot crypto" and everyone was reminding you that "This is the new paradigm that will change your life." The sad reality however, it's very easy to look very smart in a bull market. It's incredibly hard to do it in a bearish one.
The above This isn't the first example of this that I've seen. When I first started trading in the early 2000's I saw this same phenomenon with the housing market. I went to Uni in Florida and saw first hand how insane it really was. I remember trying to be "the guy that warned others" about the soon to come downfall and being hated. The sobering reality came quick and unlike when you're right about a stock, being right didn't feel good. I noticed that the same pundits that were on CNBC telling people "It will be okay!" were still manning their posts. They were able to be a talking head, be fraudulently wrong, and still be the "voice of reason" after the fact. (see video below) HOW THE FUCK IS THAT POSSIBLE?
I wanted to dive a little deeper into the "guru" phenomenon and see if the Zaky thing was an "isolated event" or in fact if it's just an aggregate extreme of a larger issue. After a couple of searches I was able to find that More often than not, gurus are incorrect. Specifically, on average, the cumulative accuracy across all forecasts sits at ~47%. While thats bad in and of itself, the accuracy distribution points to even more crappy predictions. (Source: https://www.cxoadvisory.com/gurus/)
Looking at the above information, it only confirms what most people believe in the first place. "Gurus" aren't better at their job than you can be. Hell, most of them don't even bat 50%.
The important takeaway from all this is not to trust any one man or woman for results. Trust the homework. Secondarily, and more importantly, knowing your risk appetite is really the only way to ensure you can survive in any market condition. There are times when you should be aggressive, there are times when you should be very aggressive, and then there are times when you should be neutral. Don't be afraid to say you are wrong early and wait for conditions to work themselves out before getting back in.
The FOMC policy decision is set to be announced on Wednesday, March 21st.
The January effect is a seasonal increase in stock prices during the month of January.
Lululemon Athletica (LULU) is set to report Q3 earnings after the market closes today (the co reported at 4:05PM ET last quarter) with a conference call to follow at 4:30 PM ET.
AAPL is expected to report second quarter earnings tonight after the close. There is a conference call scheduled for 17:00 (the company typically guides in the press release).
GameStop (GME) is set to report Q4 results after the bell (5:00pm ET). Cap IQ Consensus estimates Q4 EPS of $2.29 (vs. $2.40 in 4Q16), revs of $3.06 bln (-12.6% y/y), with comps declining 16.9%.
The market will be paying close attention to several reports from the banking industry on Friday morning. The two "most important" being Bank of America and JP Morgan.
Guidance
Q2
FY17
Options Activity
TECHS:
Last week's downgrade took the wind out of the stock. Sellers responded with an aggressive drop below its rising 50-day moving average which has price in "no-man's land" ahead of earnings. Next key support is the 200-day simple ma near 73.
Tesla is expected to report Q2 non-GAP EPS of ($0.65) vs. ($0.48) last year with non-GAAP rev up 38% to $1.65 bln.
The stock has been very resilient despite added risks as investors give Elon Musk the benefit of the doubt.
The question you ask yourself is: "How much can I risk with a 40% stop out and still fall under/at $100 loss on the day?"