Current Quarter Expectations: As usual, operating income and revenues estimates are near the upper end of AMZN's prior guidance.
Wolf's Den
Viewing entries in
Stock Market
Current Quarter Expectations: As usual, operating income and revenues estimates are near the upper end of AMZN's prior guidance.
Current Capital IQ consensus stands at EPS of $8.04 on Revenue of $20.77 bln.
Key Things to Watch


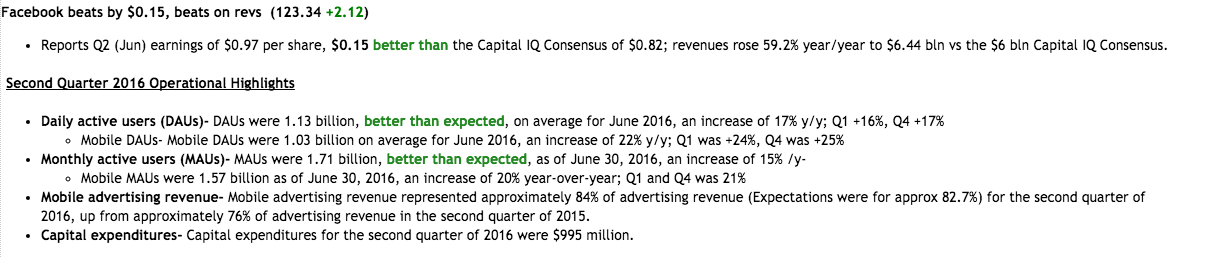
Current Capital IQ consensus stands at EPS of $0.82 on Revenue of $6.00 bln.
Q1 Recap


Q3 Capital IQ consensus calls for EPS of $1.39 (versus $1.85 last year) on revenue of $42.126 bln (-27% YoY). The current consensus is near the mid-point of the company's guidance of $41-43 bln.
The current Capital IQ Consensus Estimates call for Q2 EPS of $0.94 and revenues of $3.09 bln. VZ expects full year 2016 adjusted earnings to be comparable to the co's full year 2015 adjusted earnings of $3.99 EPS
Last quarter, Under Armour beat Q1 EPS estimate by $0.02, reported revs in-line, guided Q2 operating income / revenues in-line and slightly raised FY16 guidance / reaffirmed margin guidance.
Headed into the print: UA has held onto these recent gains and is back near pre-Q1 levels.
Based on UA options, the current implied volatility is 14% higher than the historical volatility (over the past 30 days). UA Weekly Jul29 $42.5 straddle is currently pricing in a move of ~8% in either direction by weekly expiration (Friday).
Key metrics and areas of interest:
Techs:


Close to 40% of the S&P 500 will report their quarterly results this week. That includes McDonald's, which will report before the open on Tuesday.
As I've been telling you guys for months now, the rate increase is not likely to occur in June and most likely to occur in July. My rationale for this has always been two fold: 1) Brexit and 2)A rate hike now is too soon and one in September is too close to the election. Last week's data gave the markets a quick rattle but by the end of it investors and traders had been calmed by the depreciation in likelihood that the Fed would move in June. Well like a kid turning his homework in late, the market seems to be peeking over its shoulder at the Brexit event looming. With that, the market is pricing a lower possibility for a rate hike in June.
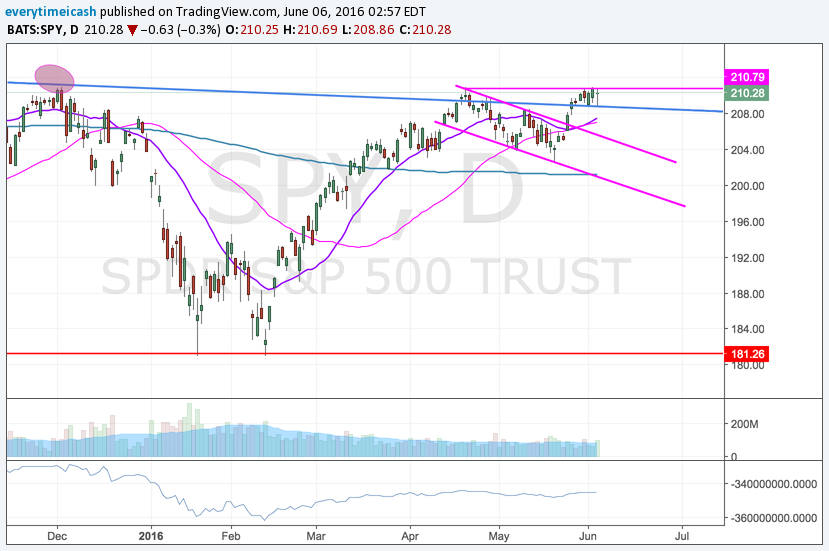
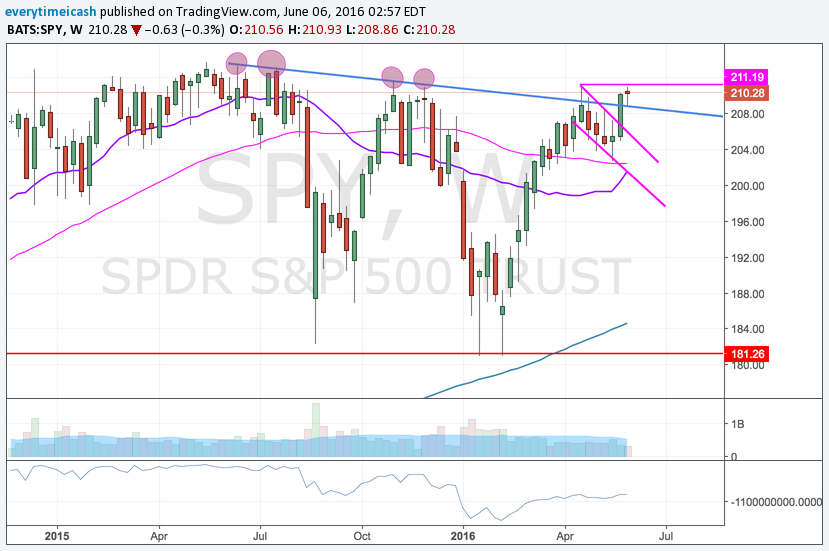
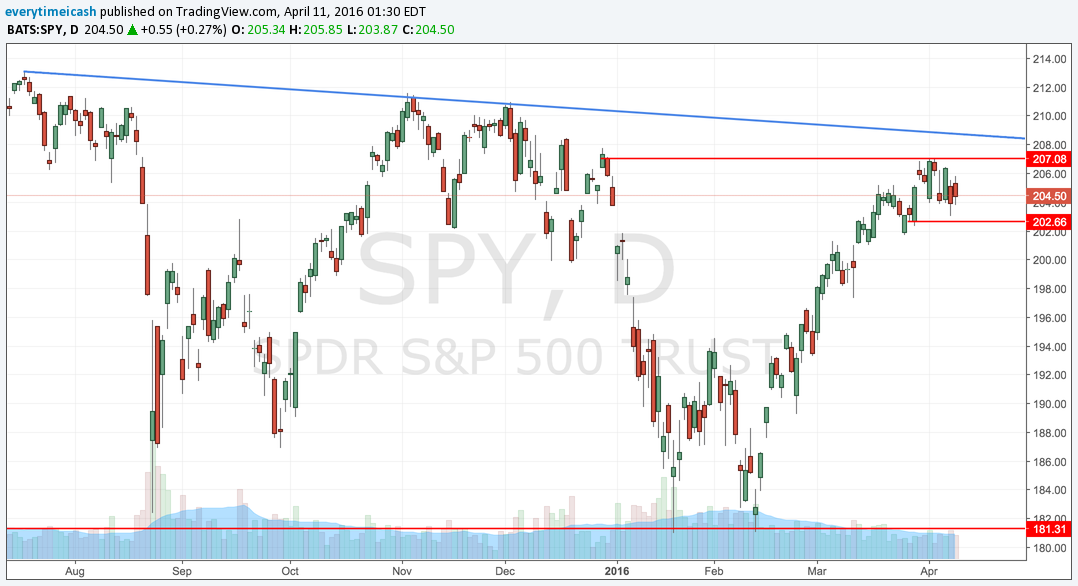
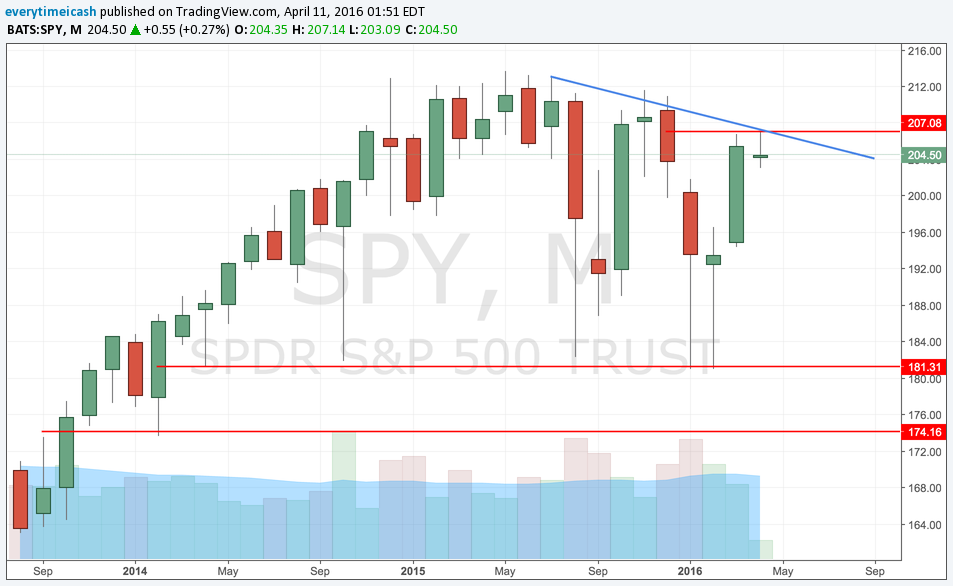
That said, we are sitting at 2100 with the potential of an all time high breakout in the stock market. My bias is that we will eventually take out the highs, continue to rally and cause capitulation before ultimately falling apart. So for now, the pain trade remains to the upside until a catalyst occurs to "shake things up". With that in mind, I'm focusing primarily on stocks that are poised for higher. Below are the SPY charts to keep an eye out including a FIBS chart for potential resistance.
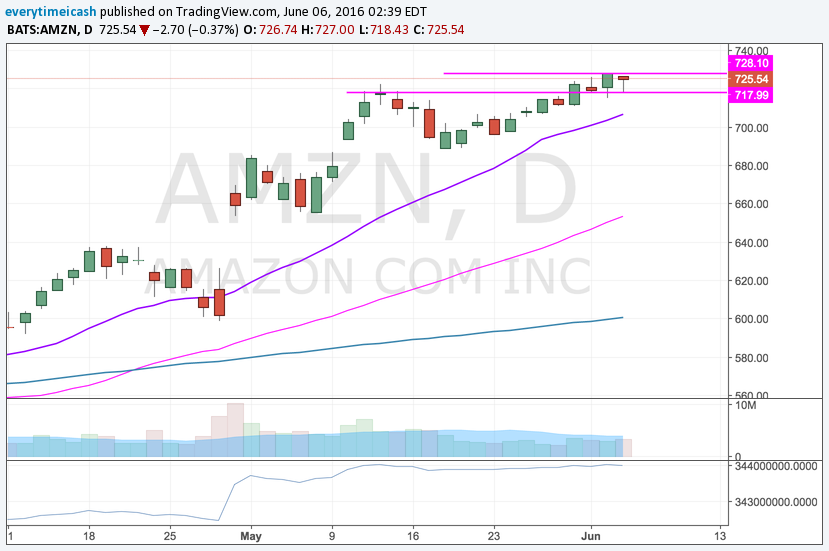
Winner winner. 717 support.
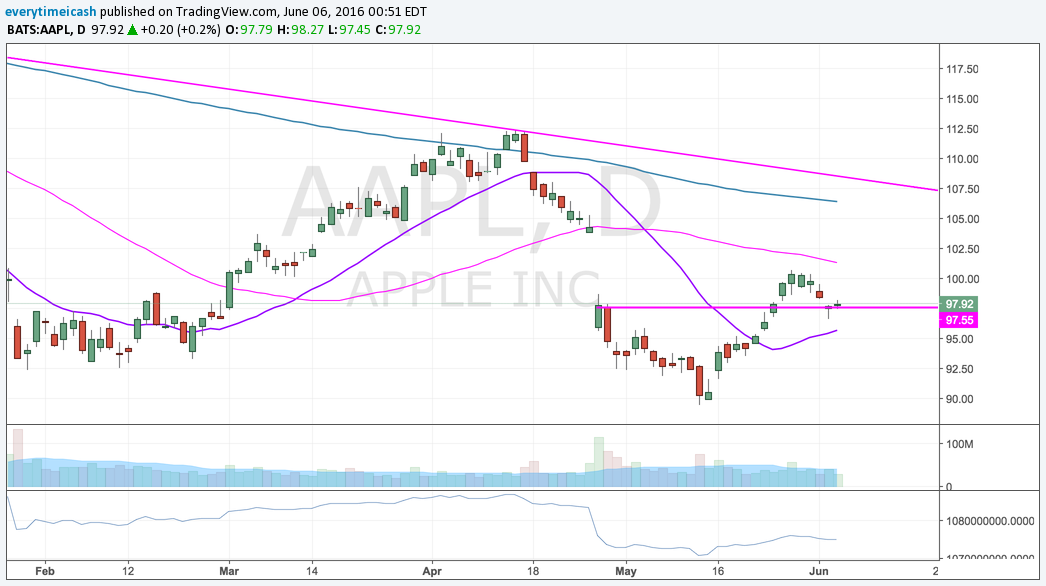
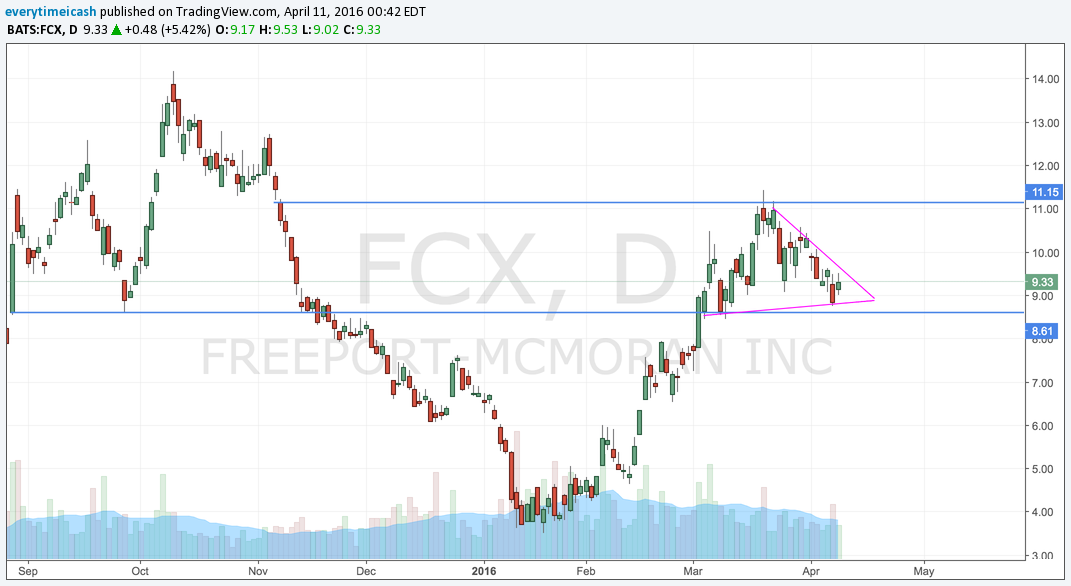
Could be at support retest, could be a cup and handle, could be a rollover. It all depends on how 97.5 will hold.
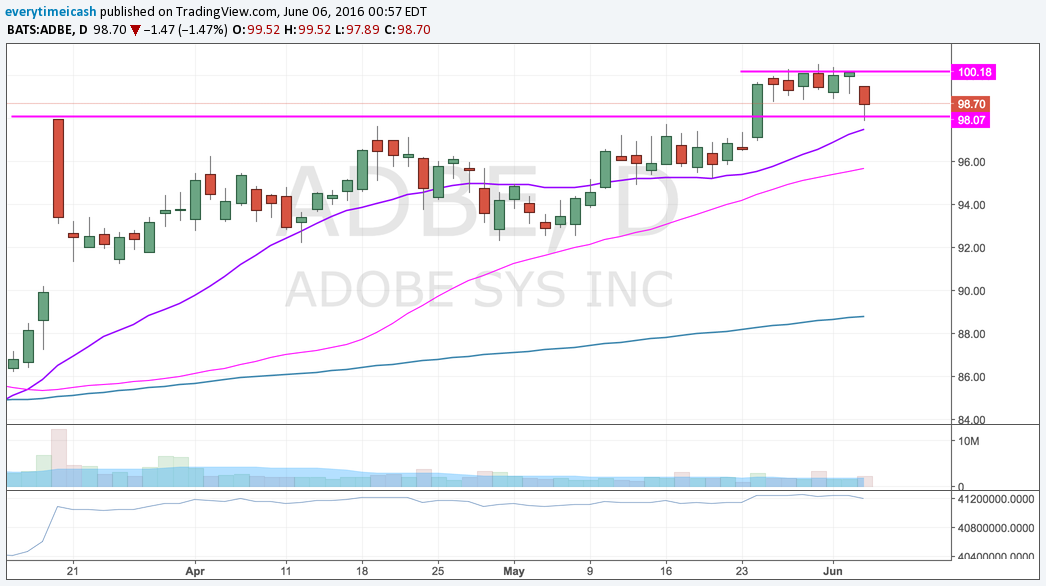
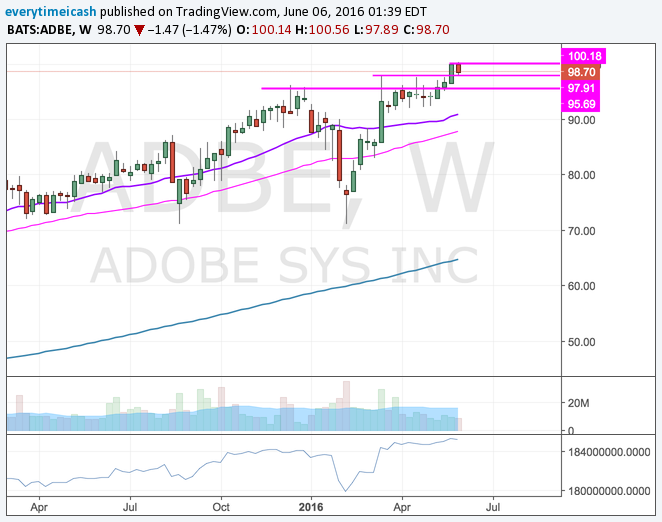
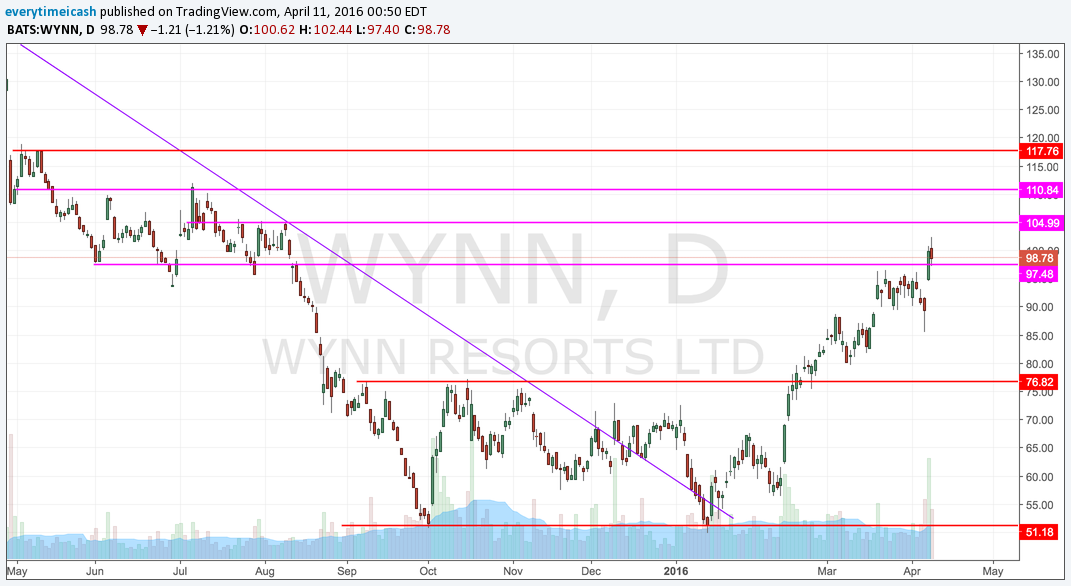
Support retest held. This should be a long so long as this holds. Rising MA's should push this higher moving forward. 100.30 is the breakout.
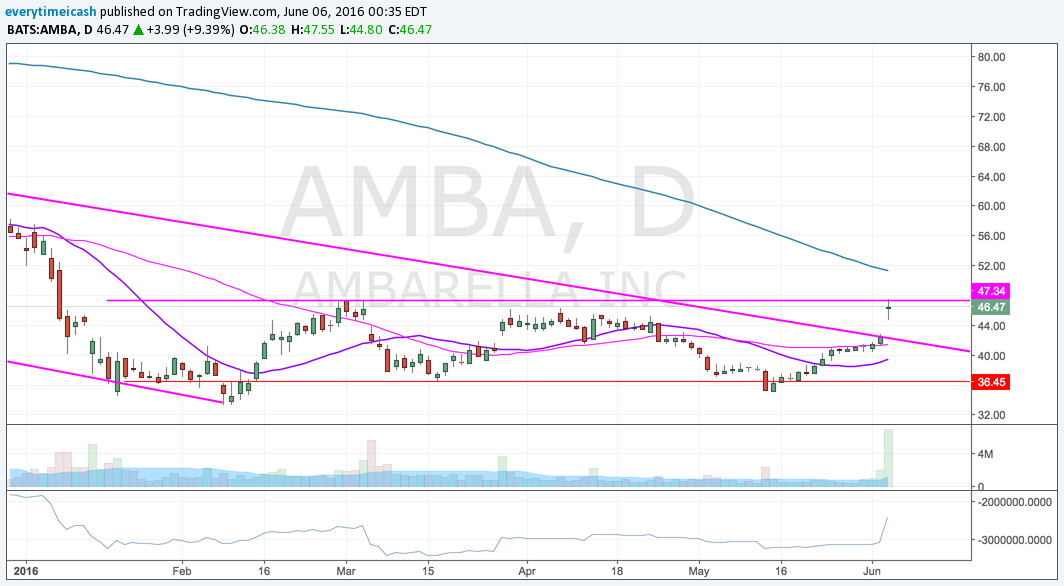
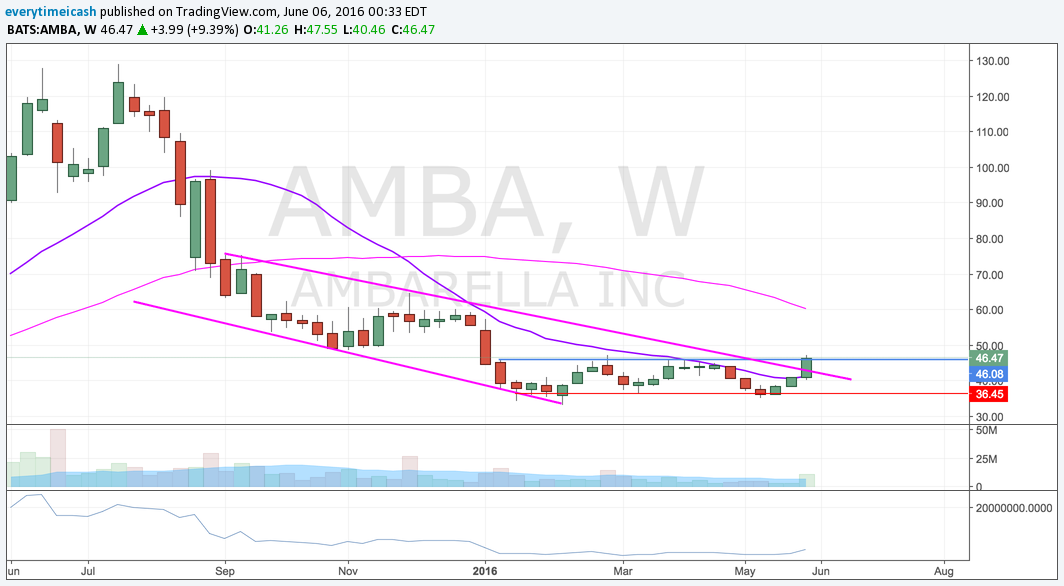
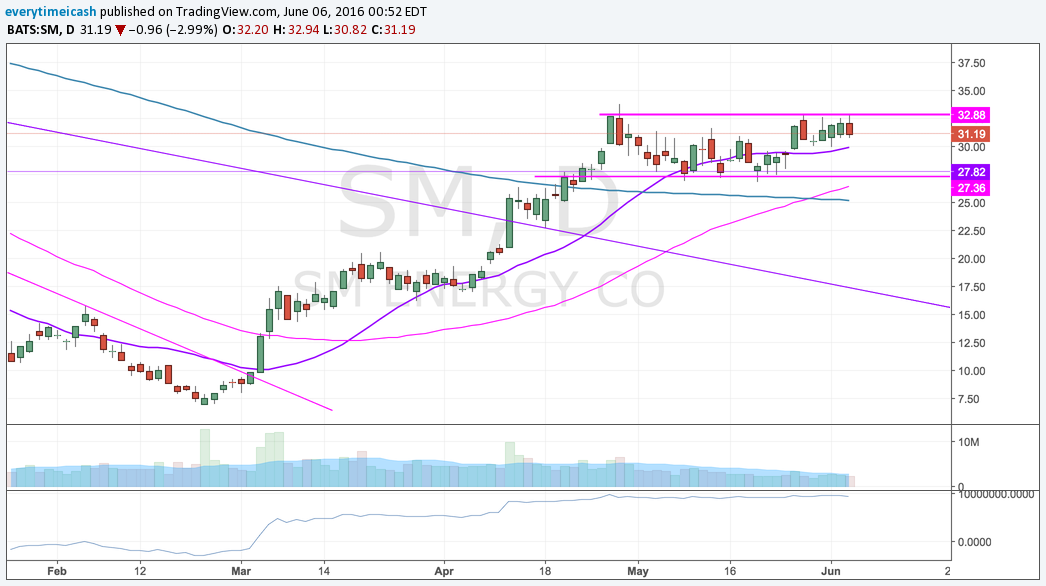
Heavy short interest, zero debt, channel break, and now an issued buyback. This should catch gas to the flames soon and continue its way higher. Read this post if you are interested in swinging this name and/or want more details.
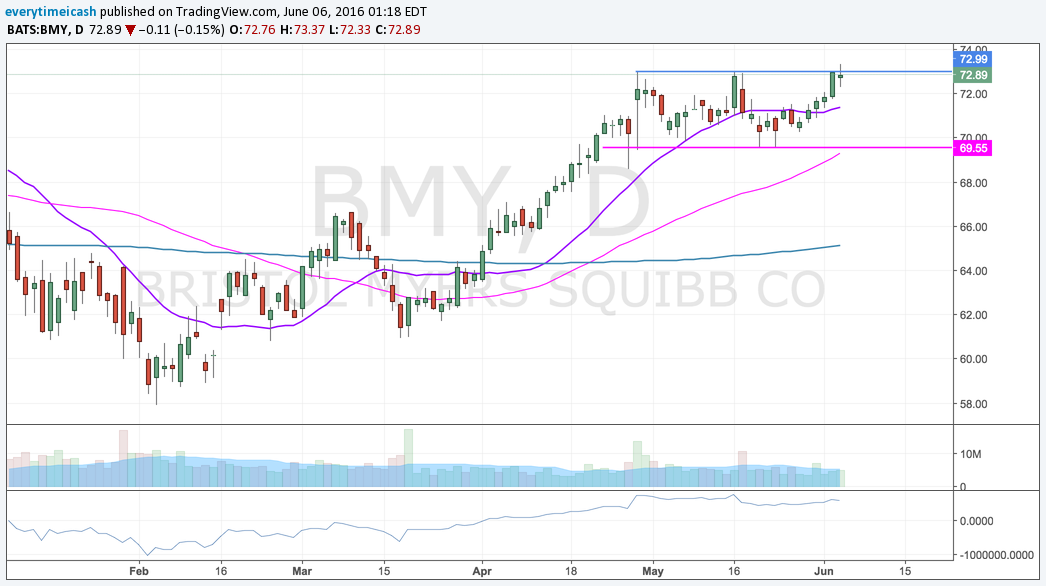
This name is itching for a breakout. Here is your level.
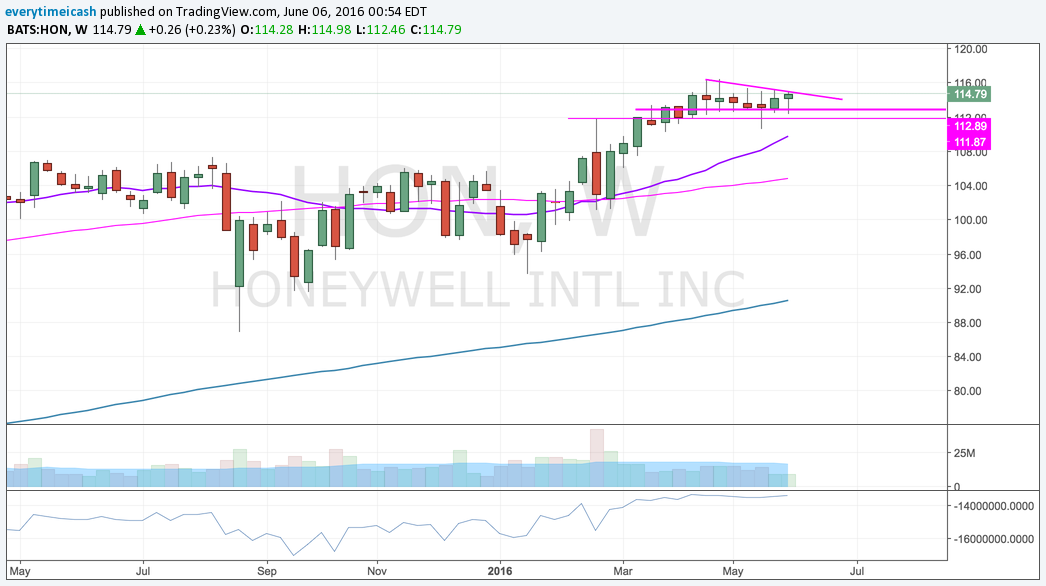
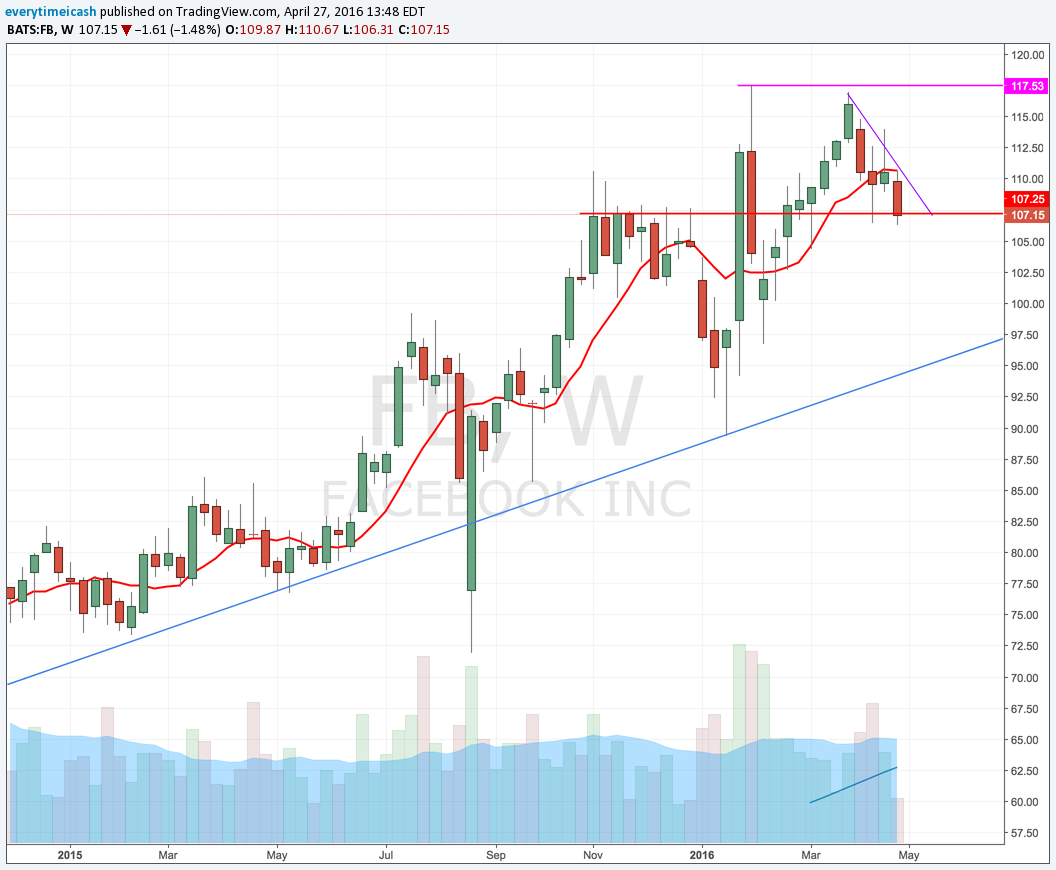
Flagging with 112 as support. Look for continuation.
Backtest of the breakout. Ready to rip again.
Strongest sector on the board at the moment. After months of consolidation, this sector is set to go. This one may get extended quickly so tread lightly.
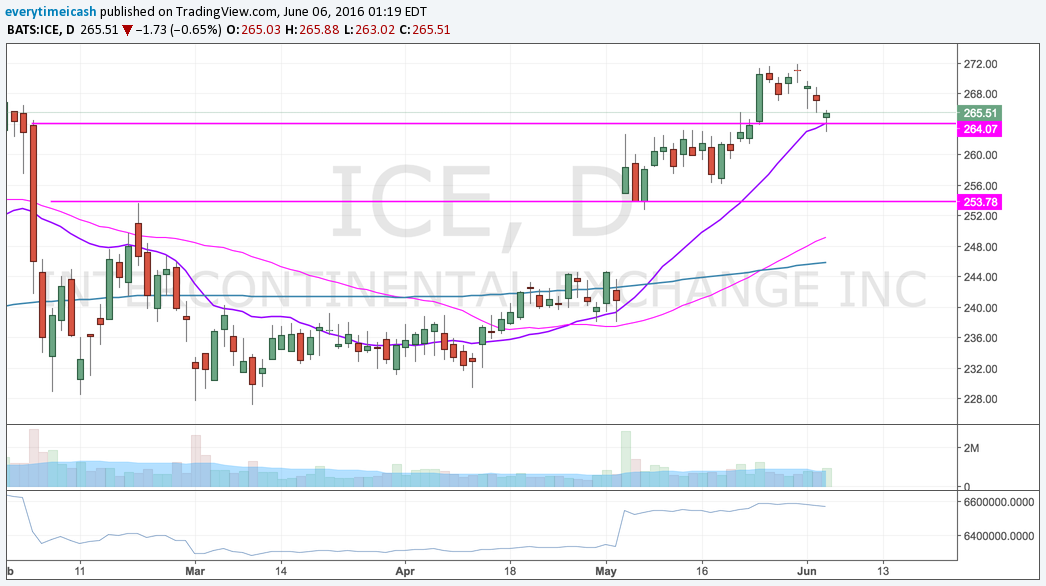
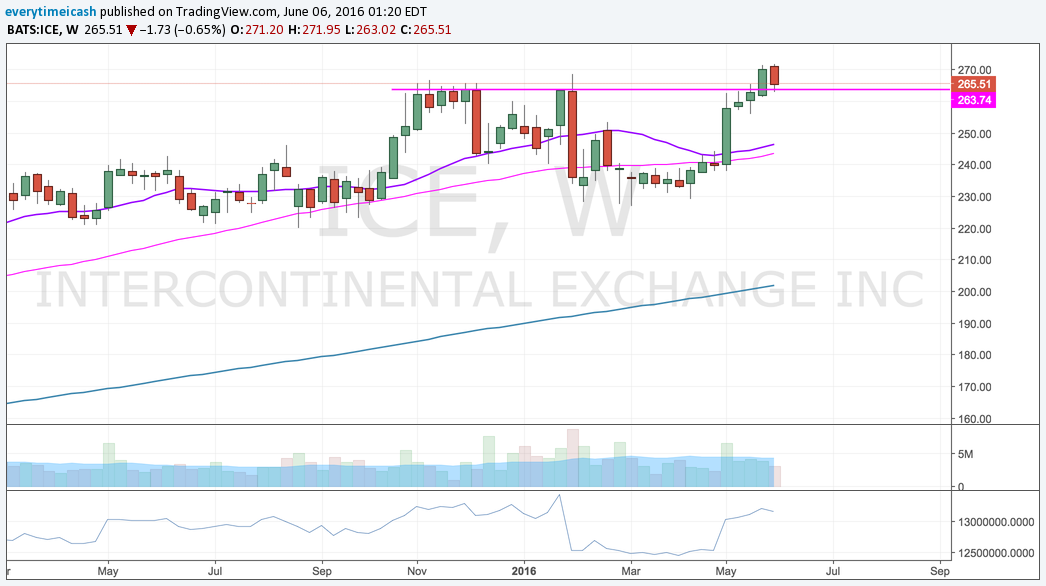
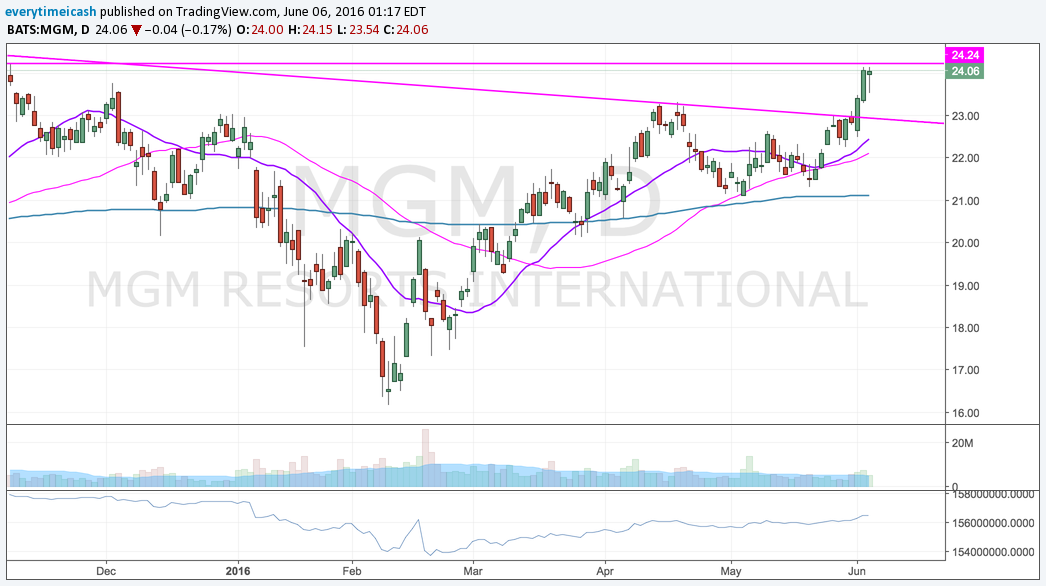
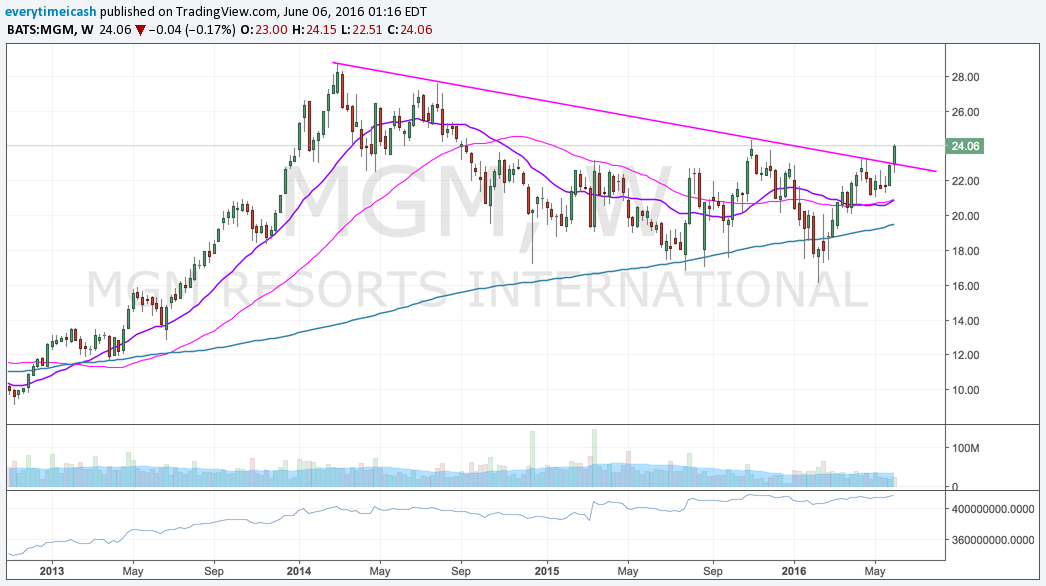
Broke out of multi-month downtrend. Add it to your bullish list. Lowest Macau exposure of all the casinos. 24.35 will lead to further upside.
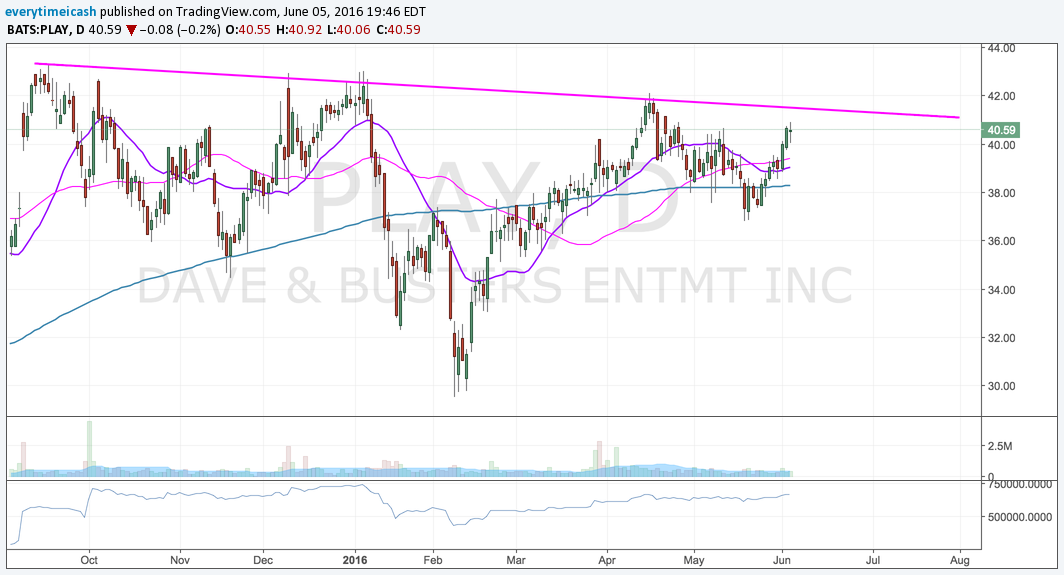
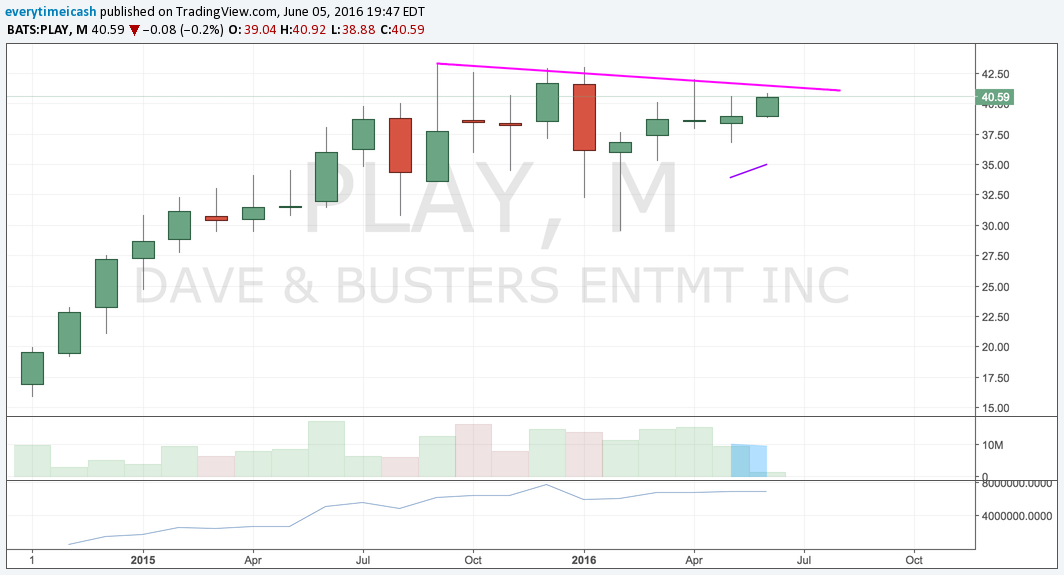
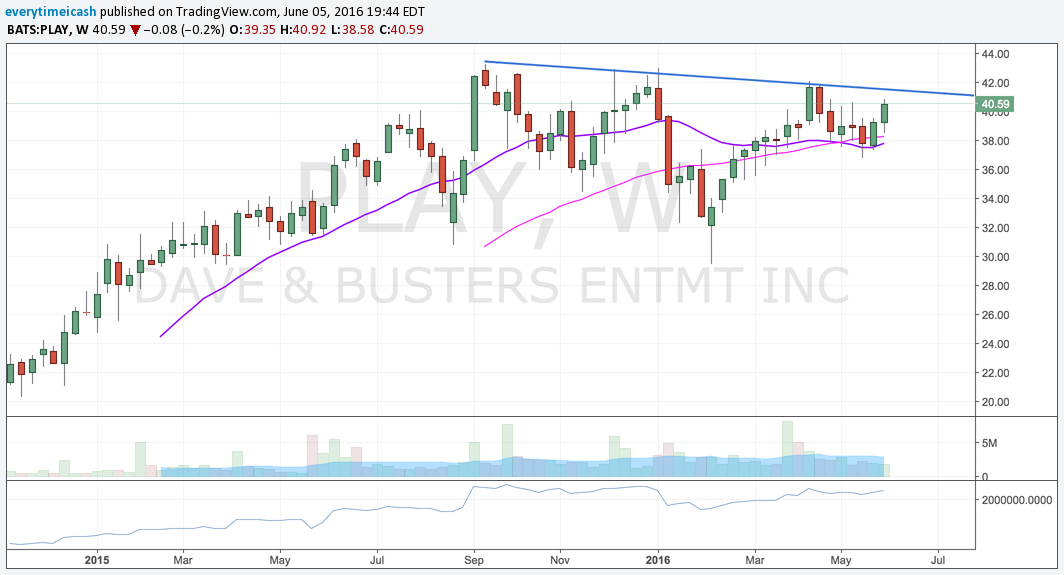
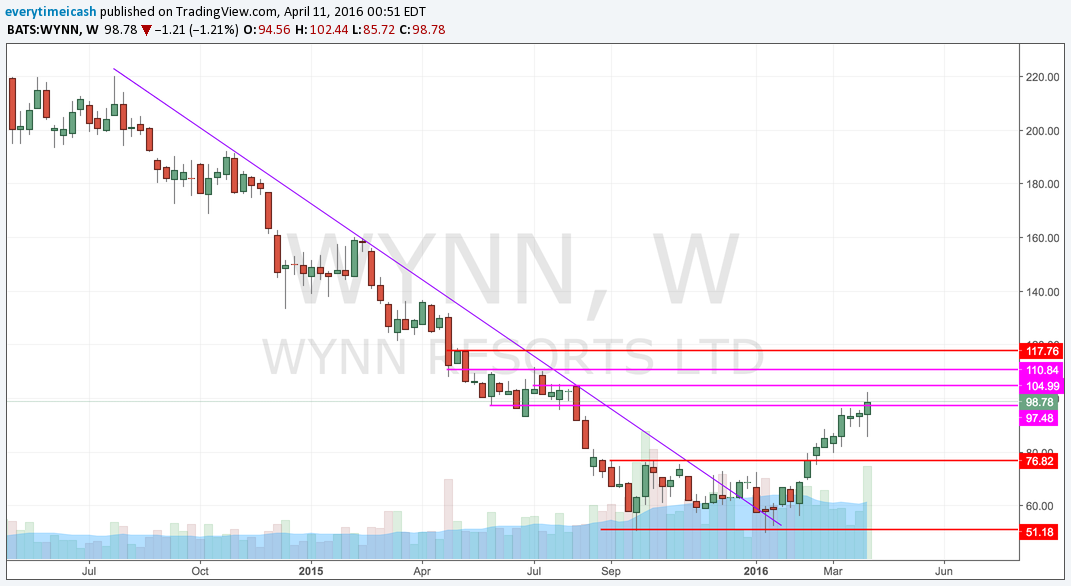
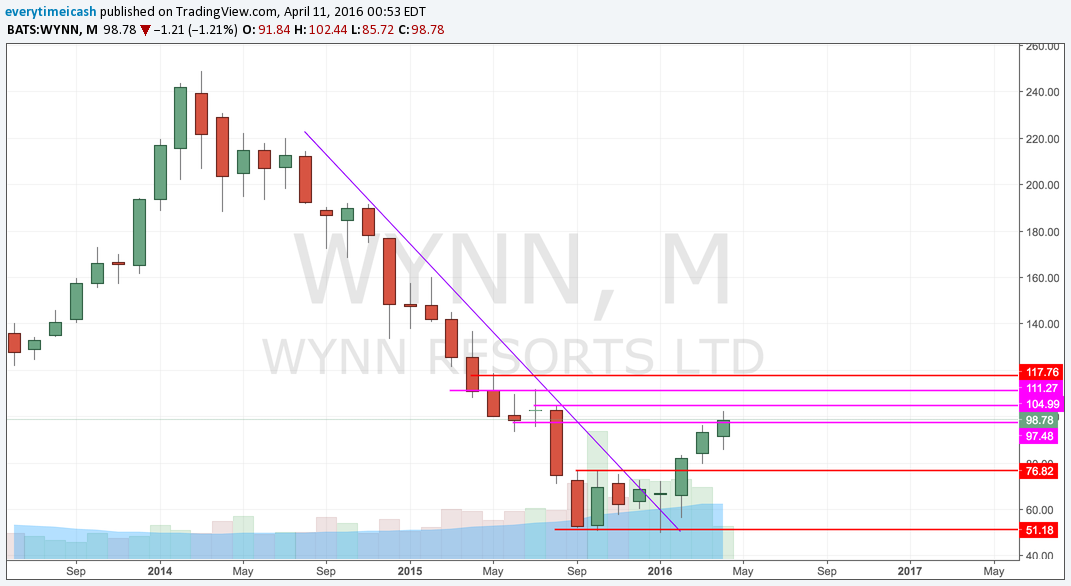
Clear downtrend about to break on all time frames. Extremely bullish chase if that occurs.
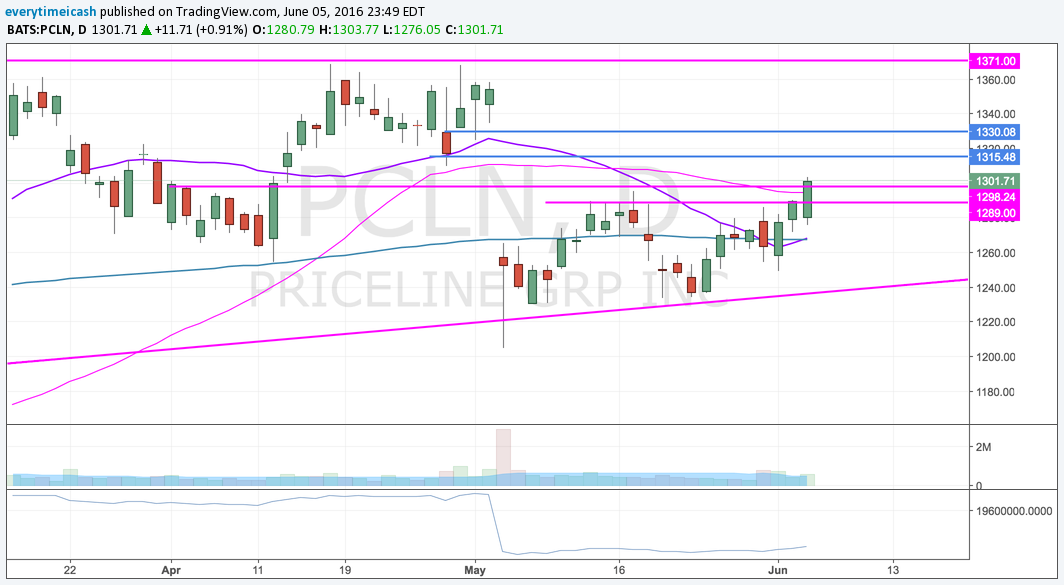
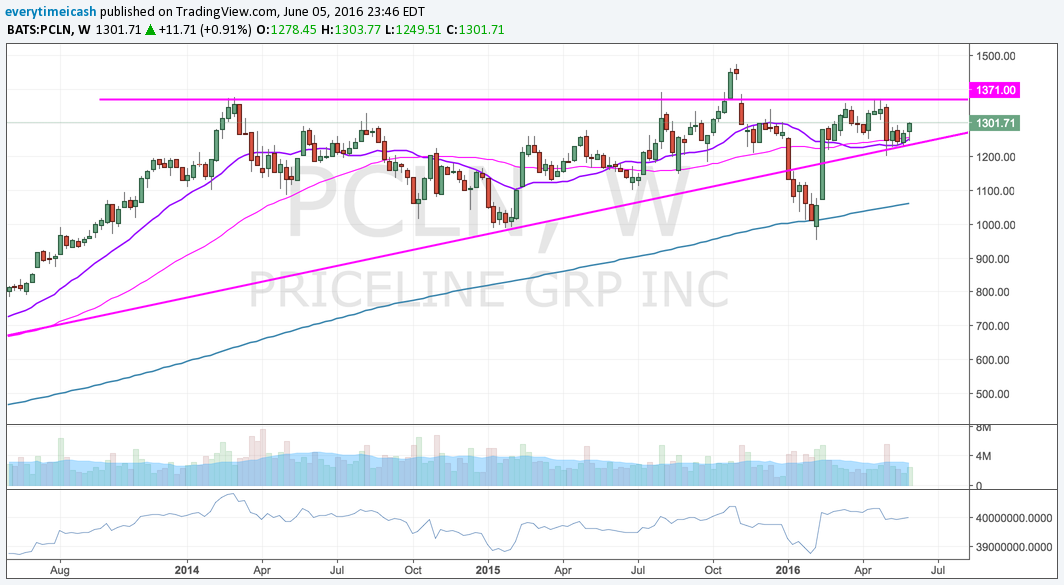
Faked a breakdown and took off. It has been in an uptrend ever since. If this plays like the market has been of late it's poised to fill the gap into the 1317 1331, and 1340 levels and possibly beyond.
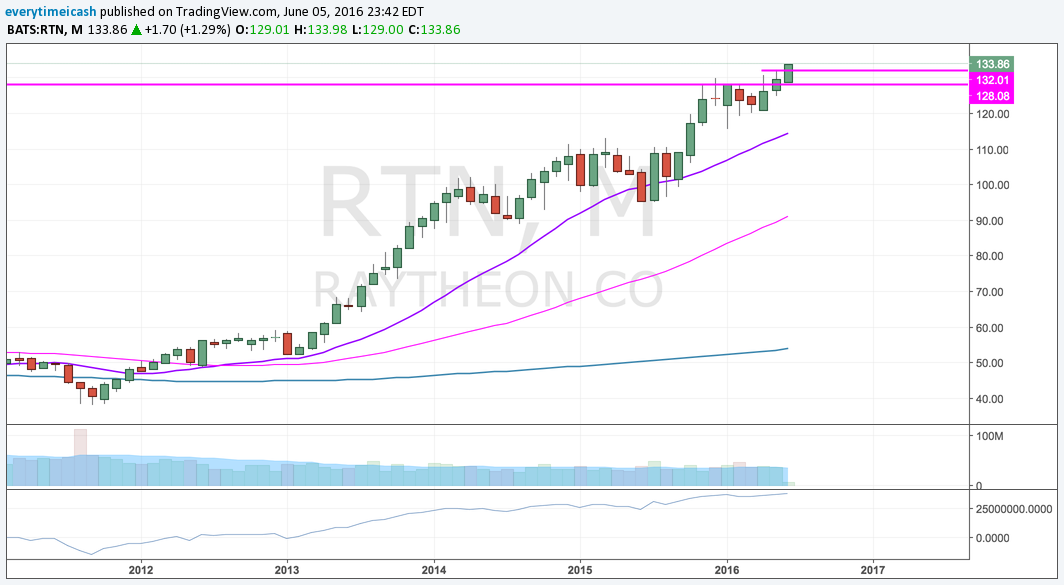
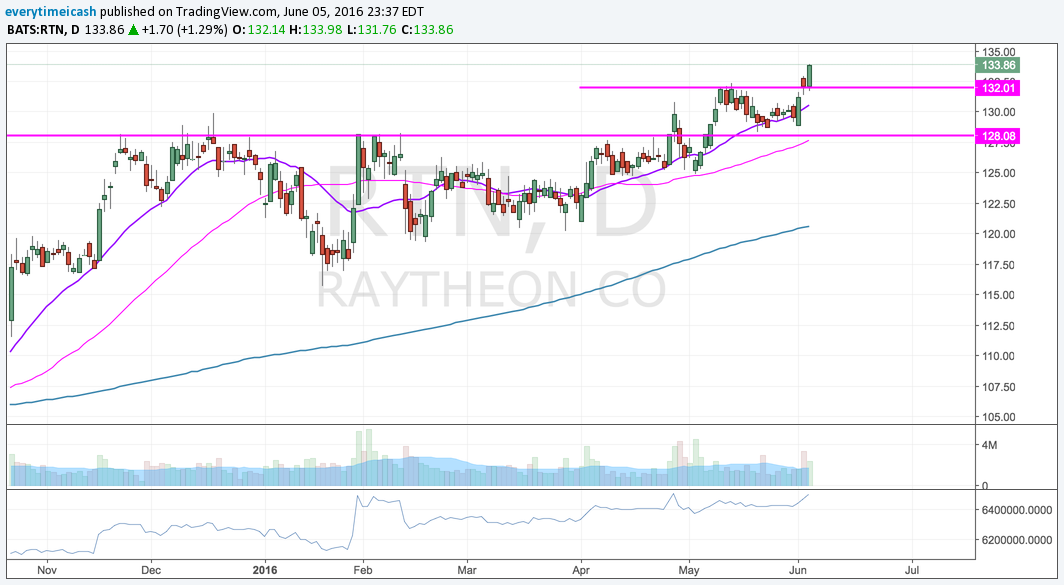
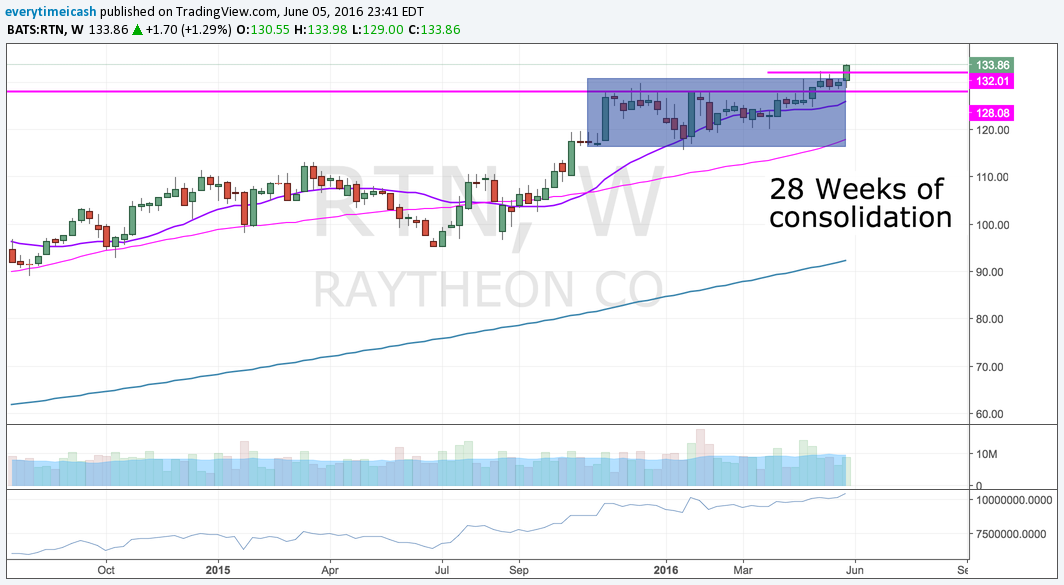
One of the strongest names in the strongest group. This had 28 weeks of consolidation. Look for a continued breakout.
Still ready.
The question you ask yourself is: "How much can I risk with a 40% stop out and still fall under/at $100 loss on the day?"
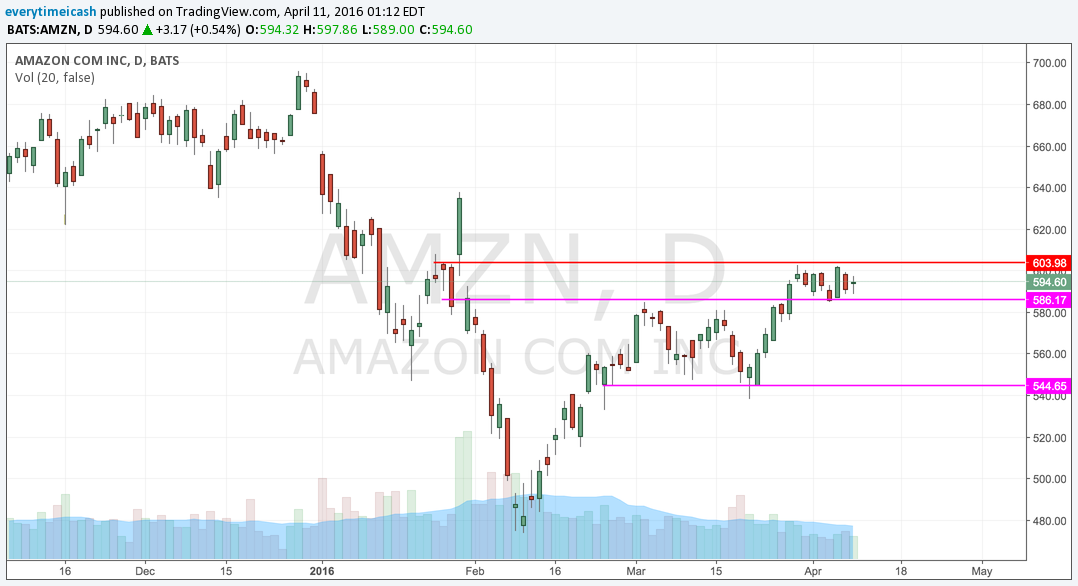
Amazon.com (AMZN) is set to report Q1 earnings today after the close today followed by conference call at 5pm ET.
Unlike many other companies, expectations for Facebook remain quite high. Failure to meet those expectations could cause a material decline in its stock, which is up 31% over the last 52 weeks.
Ad spending drives Facebook's top line, accounting for 95% of the company's revenue in 2015. FB is a barometer for how advertisers are spending and where they are allocating their advertising budgets.
Facebook has a large international presence with 86% of its 1.59 billion monthly active users at the end of 2015 residing outside the U.S. and Canada and 50% of its total 2015 revenue derived outside the U.S. and Canada. Facebook, then, will have some revealing insight to share on global economic activity and the impact of foreign currency on its operating results.
FB announced that the board of directors has approved a proposal to amend and restate existing certificate of incorporation to create a new class of non-voting capital stock, known as the Class C capital stock.
If approved, it will issue two shares of Class C capital stock as a one-time stock dividend in respect of each outstanding share of our Class A and Class B common stock. This proposal is designed to create a capital structure that will encourage Mr. Zuckerberg to remain in an active leadership role at Facebook.
“The adoption of the proposal is subject to the approval of our stockholders at our 2016 Annual Meeting of Stockholders to be held on June 20, 2016.”
FB breaks through all time high on stellar report, again.
With poor earnings from $V $SBUX $GOOGL/$GOOG and $MSFT, the market had every reason to let the bottom fall out and collapse on Friday. Though we started lower, we ended the day slightly in the positive for the S&P 500. The Q's took it early but finished moderately lower. The A/D line continues to broaden and the market continues to catch a bid. Unlike the last couple of years, the broader market participation has been stellar and it seems every couple of weeks there is a rotation into a new group. The main focal point on Friday was the IWM which ended firmly in the green. Until this musical chairs of money rotation ends, there is no reason to believe that the bears have any semblance of control. There are two levels of support currently where dip buyers step in. Near the 9 and the 20MA's. It's important that the momentum continues and the market continues to churn higher as we've broken our downtrends (for now).


Entire sector is seeing strength and is reversing its downtrend.
Flagging at its downtrend line and at resistance.


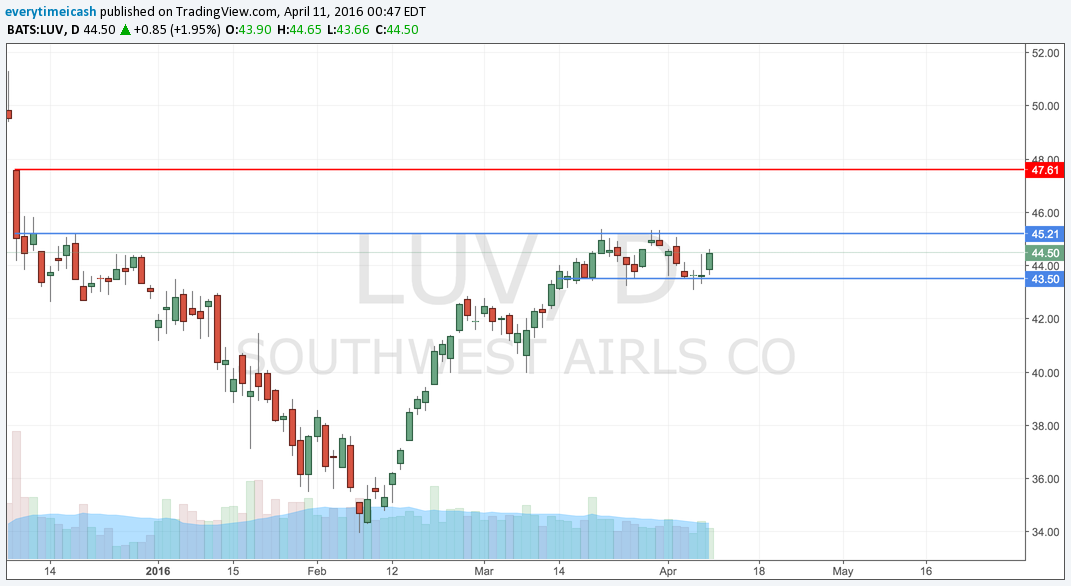
Broke monthly downtrend and breaking into resistance.


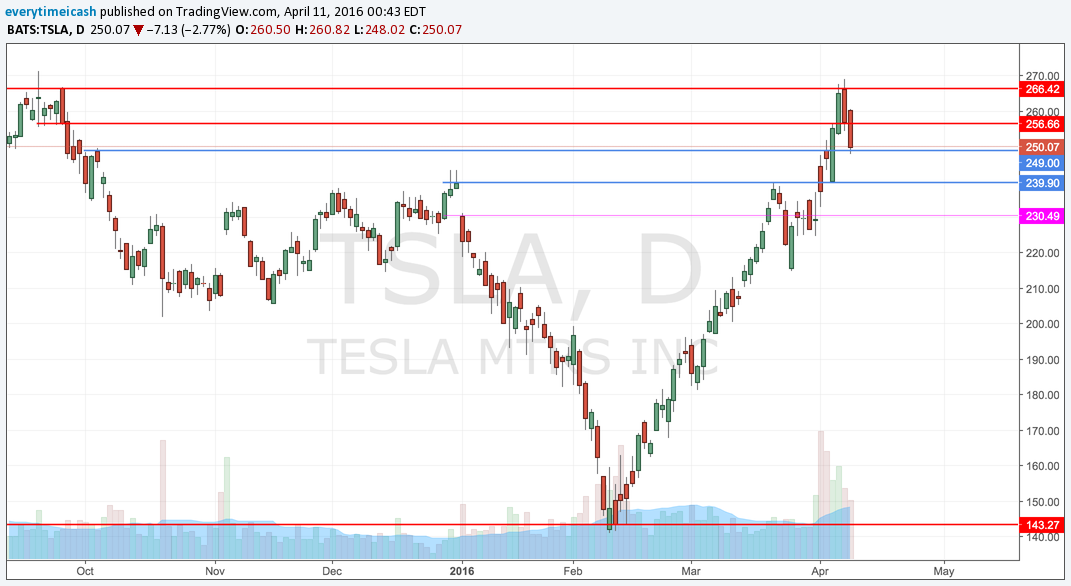
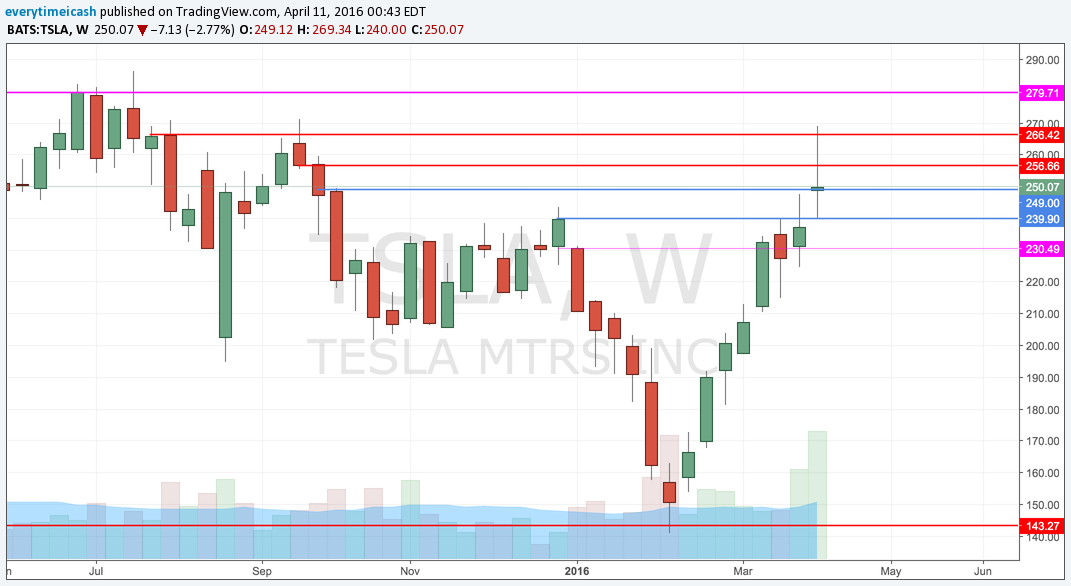
TSLA Flagging into support. 20D better hold.
Bull Flag, multi-day consolidation.
Flagging and ready to break out.
Ready to rip
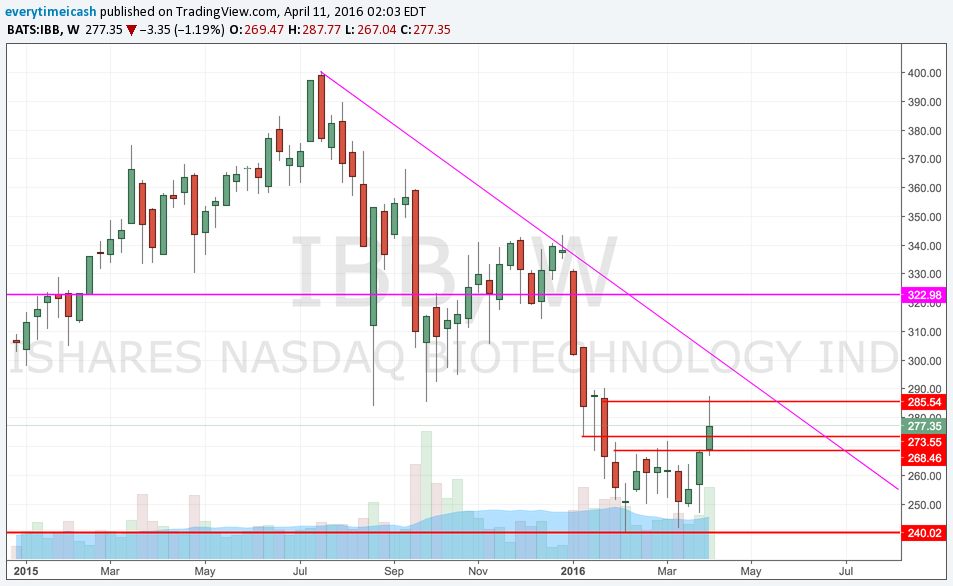
All bio ETF's are ready to rip and some have started to move.


Basing for a breakout.
Basing for a breakout
"Poor" earnings results but found support and bounced.
Breakout looming
Netflix ($NFLX) is set to report Q1 results tonight after the close with consensus at EPS of $0.03 on Revenue of $1.965 bln.
Q4 Recap: IBM beat on Q4 non-GAAP EPS of $4.84 vs the $4.81 Capital IQ Consensus and reported revenues in-line at $22.06 bln.
As expected, last week showed us a range bound week (inside week) following a 12% run up in the SPY. Action was quite volatile relative to the last few weeks with a couple of false breakouts and breakdowns.
The SPY was range bound last week with 20 and 200MA functioning as support. As highlighted last week the 2030 level has functioned as support for the SPX and 2070 has been resistance. After last week's inside week we're going to pause for a break to the upside above 2070 or a breakdown below 2025. My bias is that a new wave of leadership is forming in the markets and that this rally in gold can propel for a while longer. That said, the SPX/SPY is in a downtrend since May of 2015 with lower highs. We will in fact see as earnings season kicks into high gear and the banks start to report.

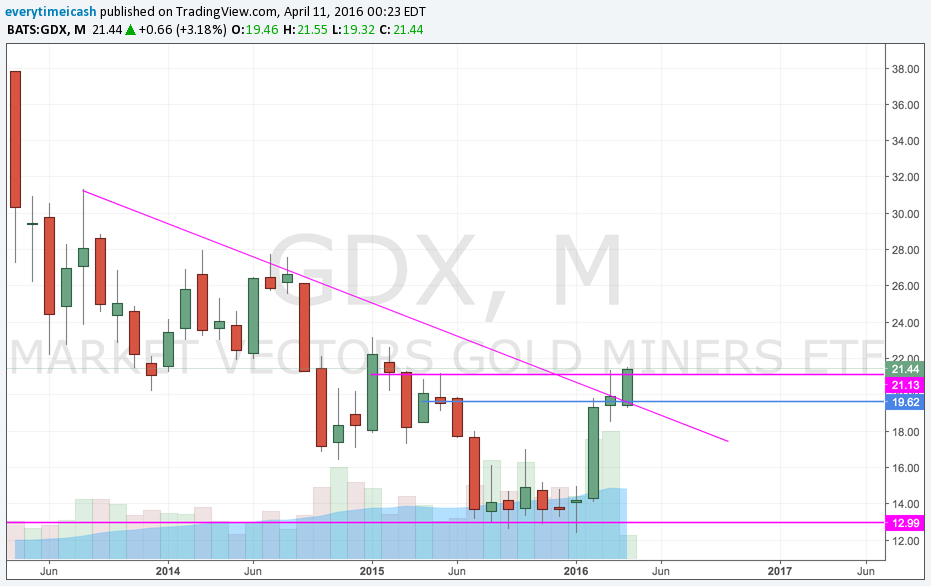
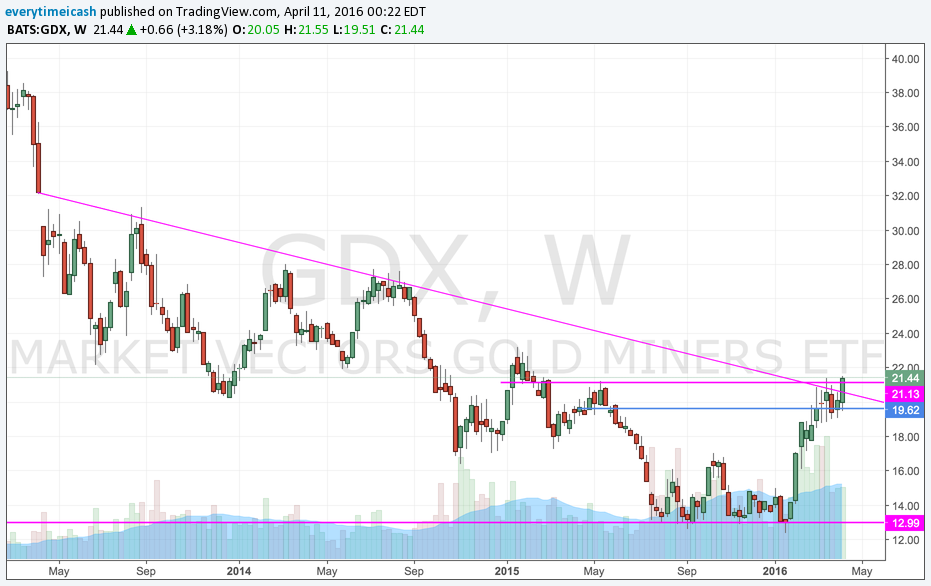
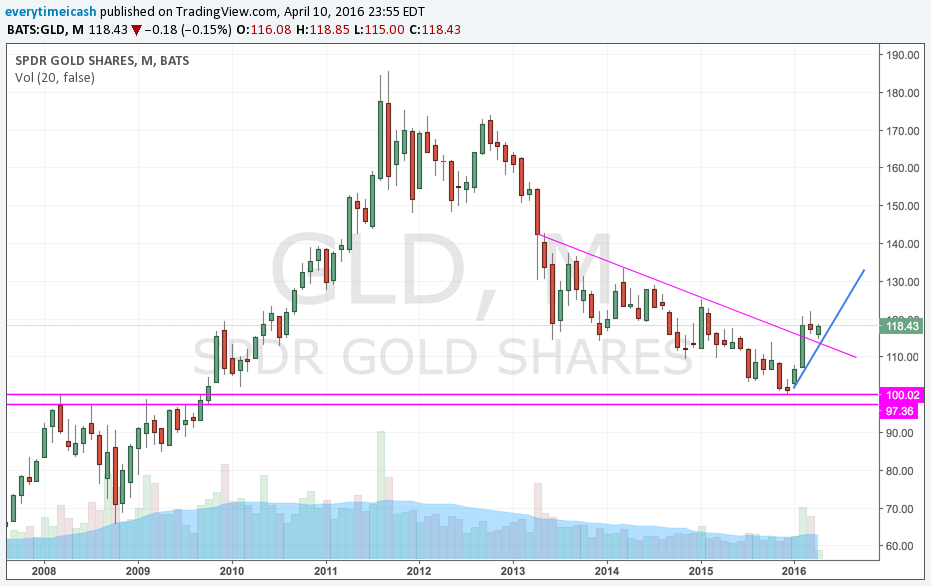
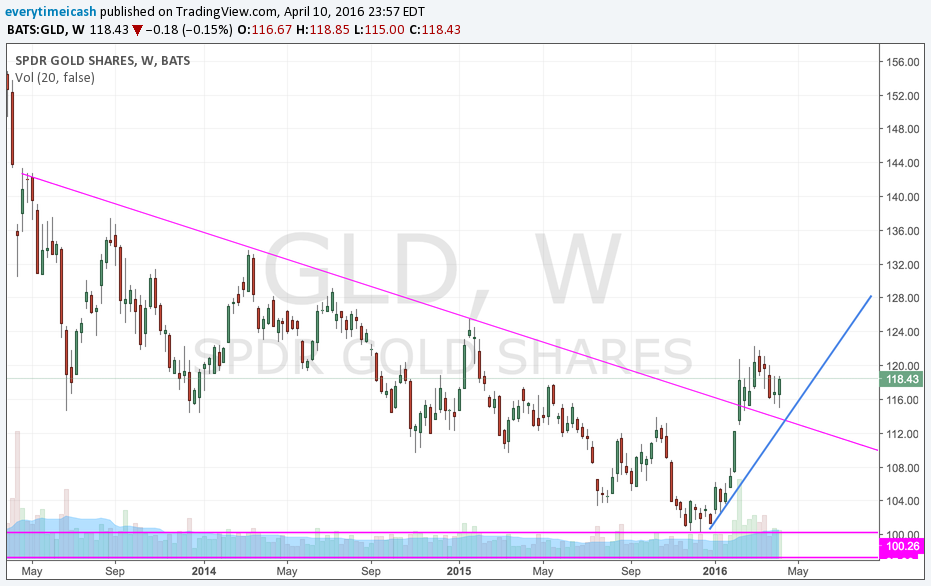
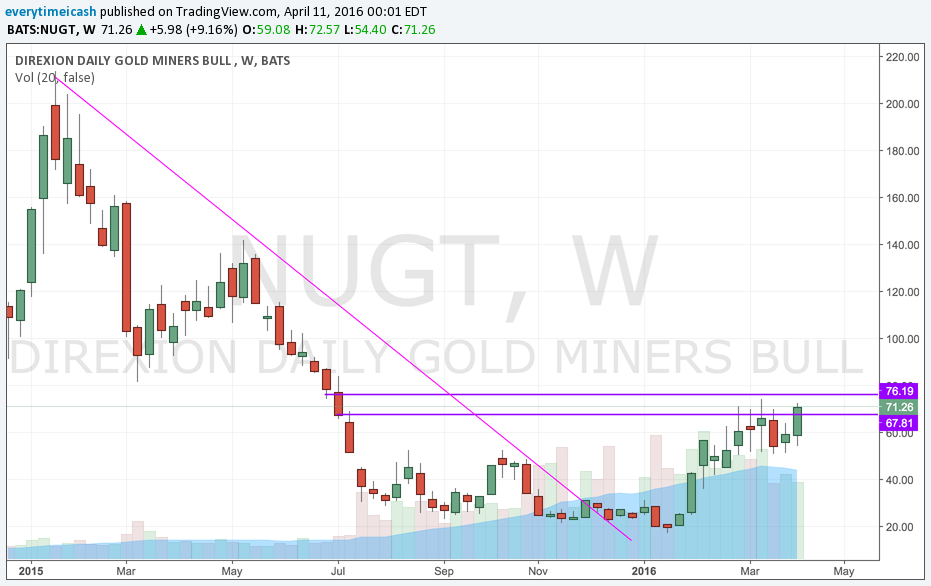
As seen recently, gold has begun to break out as it broke its downtrend with a higher high and channel break. After a period of consolidation, it is apparent gold is ready to make its run again. As gold goes, so do its derivatives
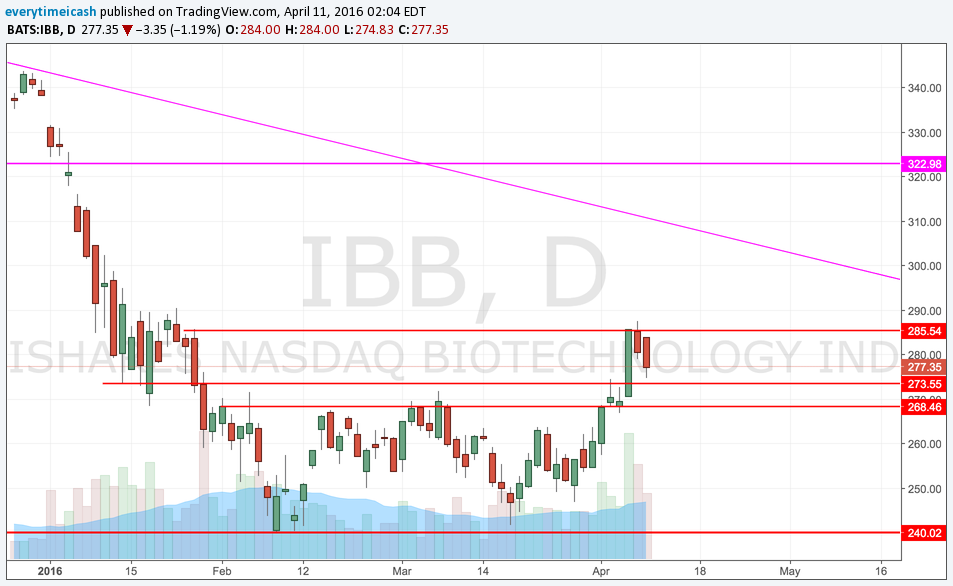
As noted two weeks ago, the IBB bounced of its 50% retrace from the highs and has continued the run since. Our target of 285 was reached and we're now waiting for some consolidation before a potential run higher. A potential retrace to the downtrend is what we're potentially looking for.
Aggressive call buying into consolidation and this one is set to take off higher.
After a torrid run up almost doubling its share price in approximately six weeks, TSLA finally hit resistance and started to turn lower.
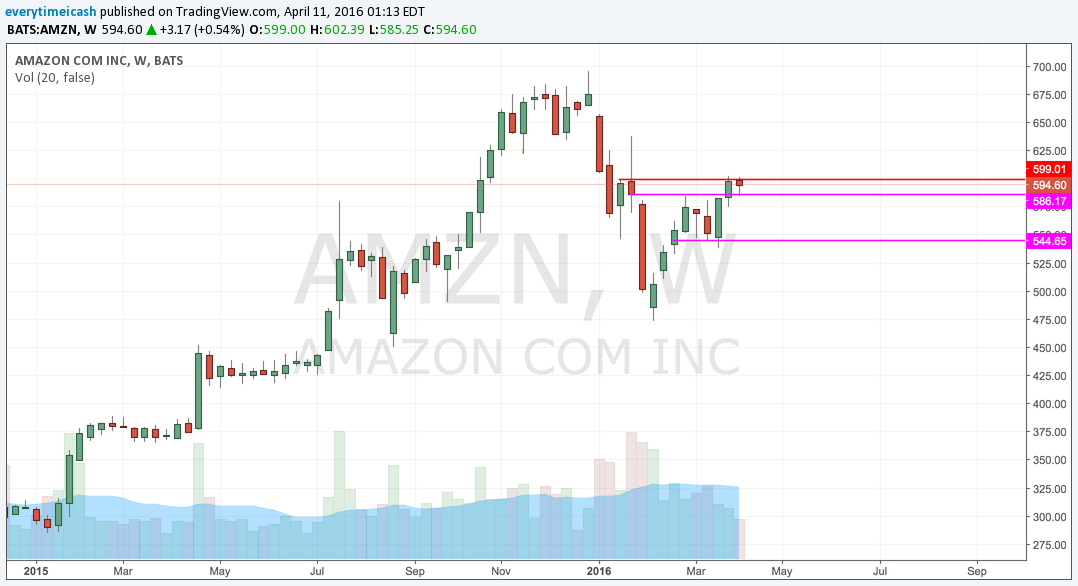
After a face rip week, last week saw some consolidation. We're working with a flat 200MA and a breakout above 604 to spark this thing.
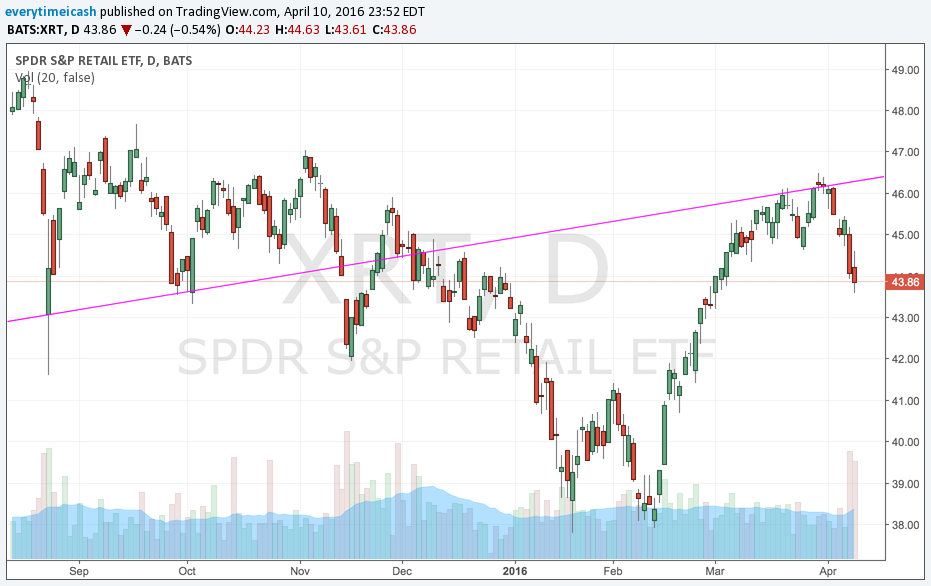
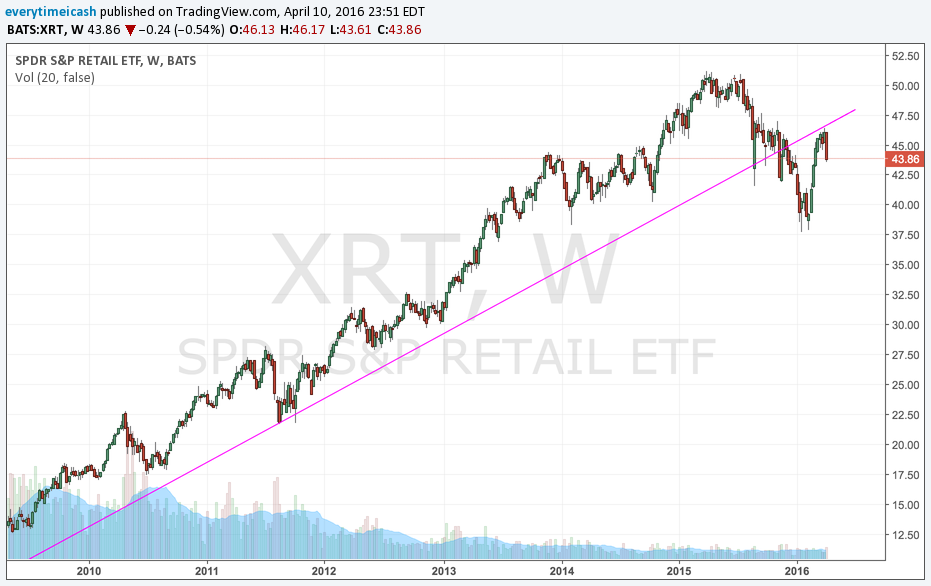
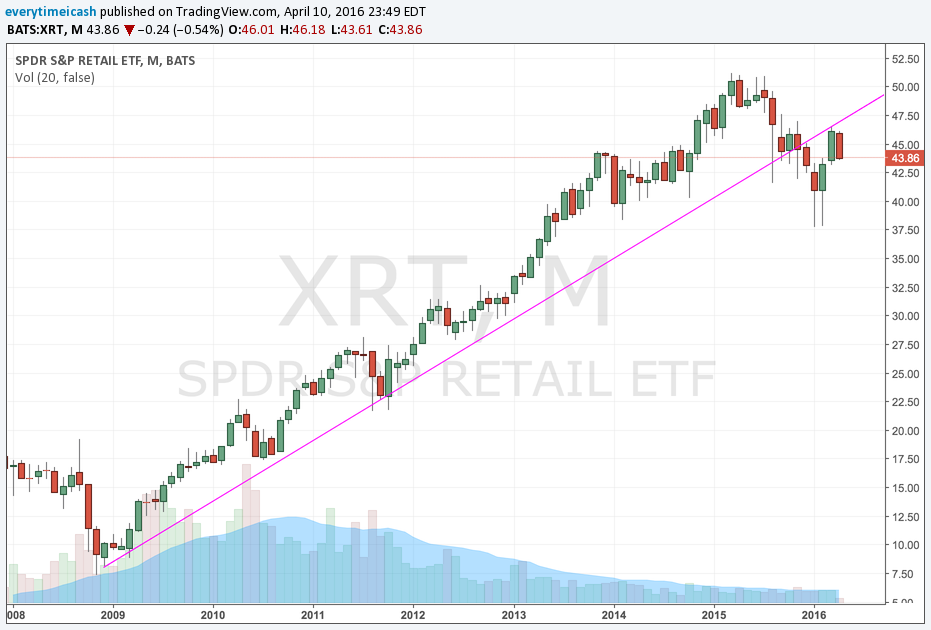
After leading us on the way up, XRT has started to roll over as it hit resistance into its previous up trend.
Both in a flag and looking to break up or down. (Bias Up)
Ignore the "Fast Money" stupidity by the guy who has a 17% stop. Stick with trend until it's broken. Currently 97.5 has functioned as support and below that is the box breakout support of 96. Last week we saw some continued May C buying by the wise guys.
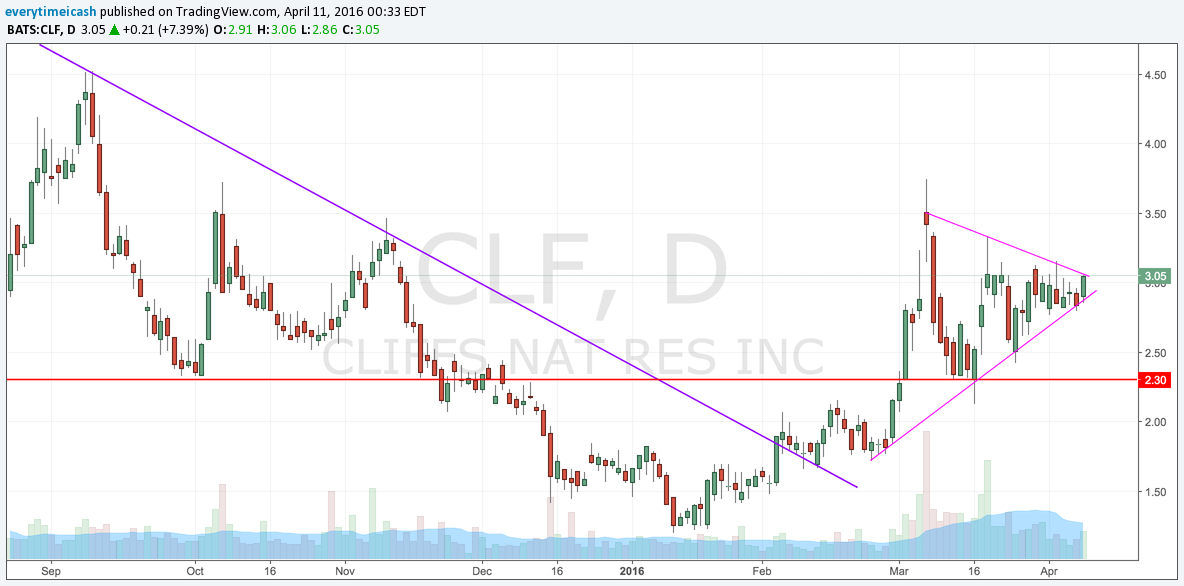
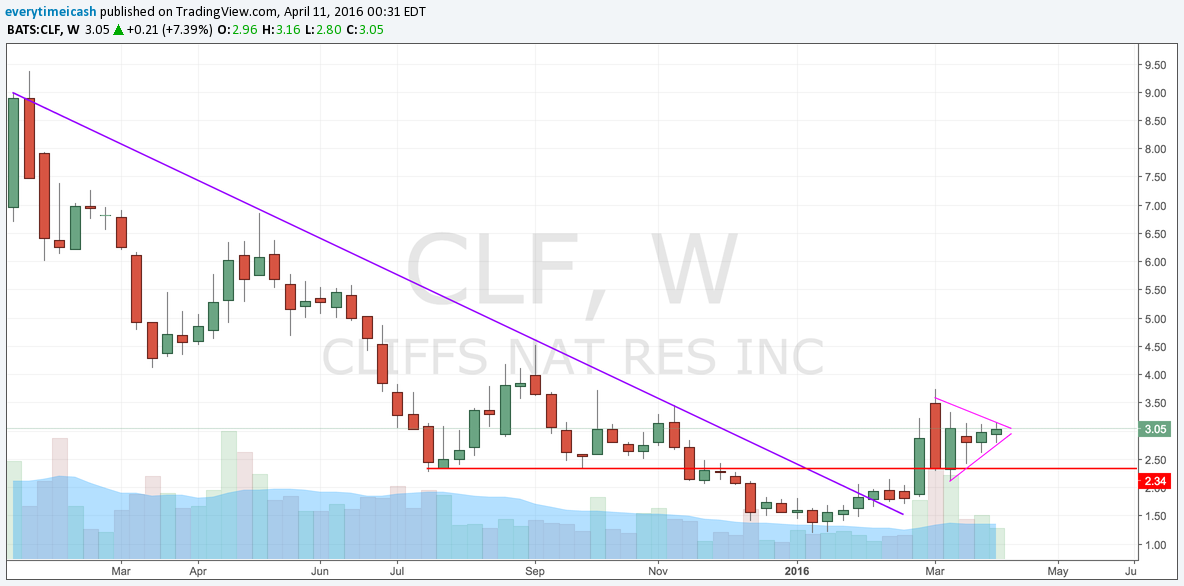
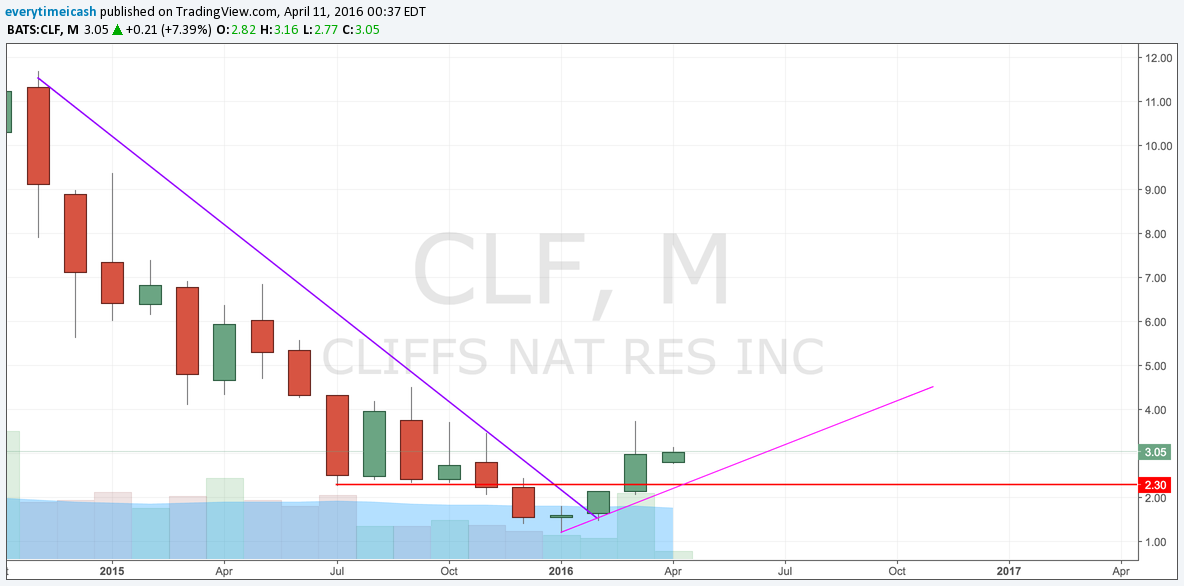
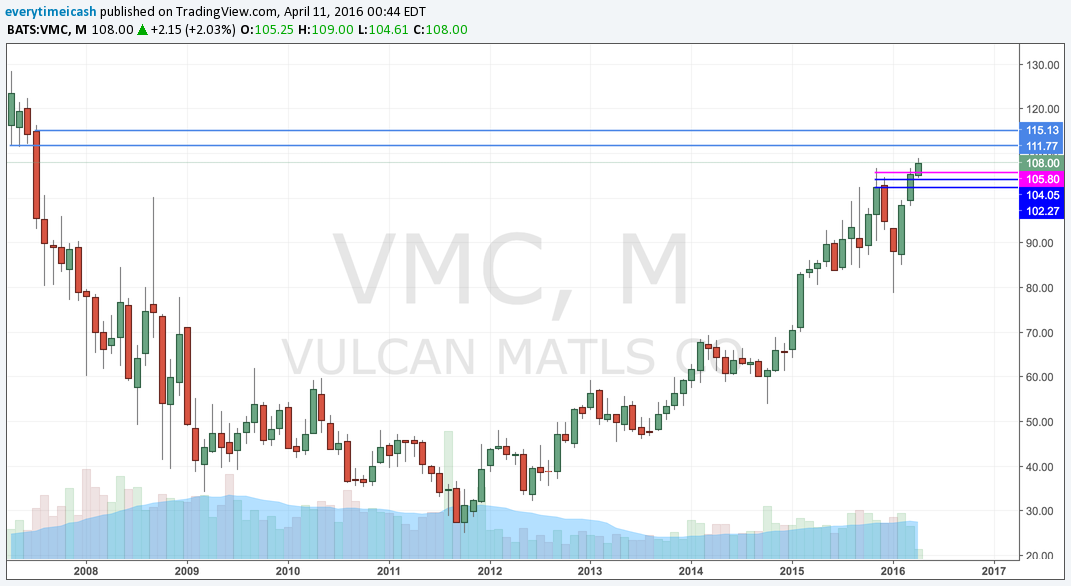
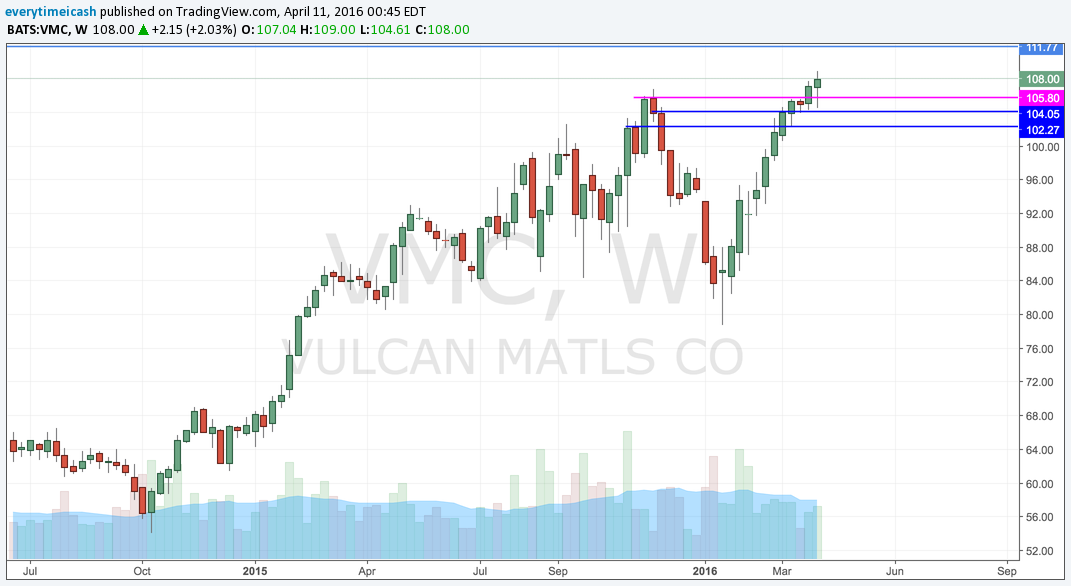
My favorite materials company out there. Period.
Some China names have recently caught a bid and my favorite setup at the moment is potentially BITA.
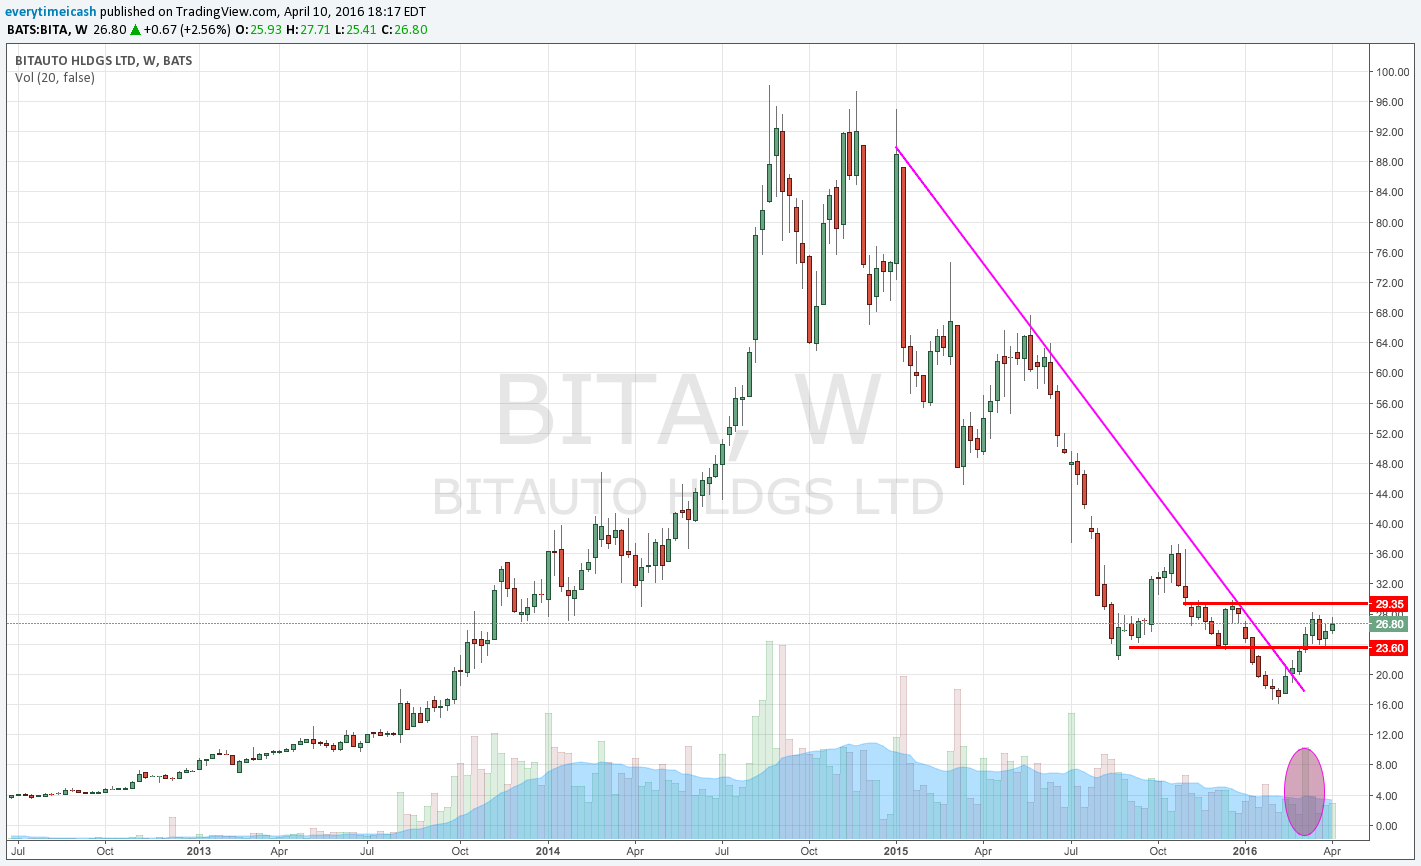
This is a former high flyer with recent accumulation volume.
This showed a break in 2014 and has been in a downtrend since. As of late however, it has showed some signs of stabilization in an attempt to get back to its down trend.
Basing for a potential break to the downtrend.
“Successful trading is always an emotional battle for the speculator, not an intelligent battle.”
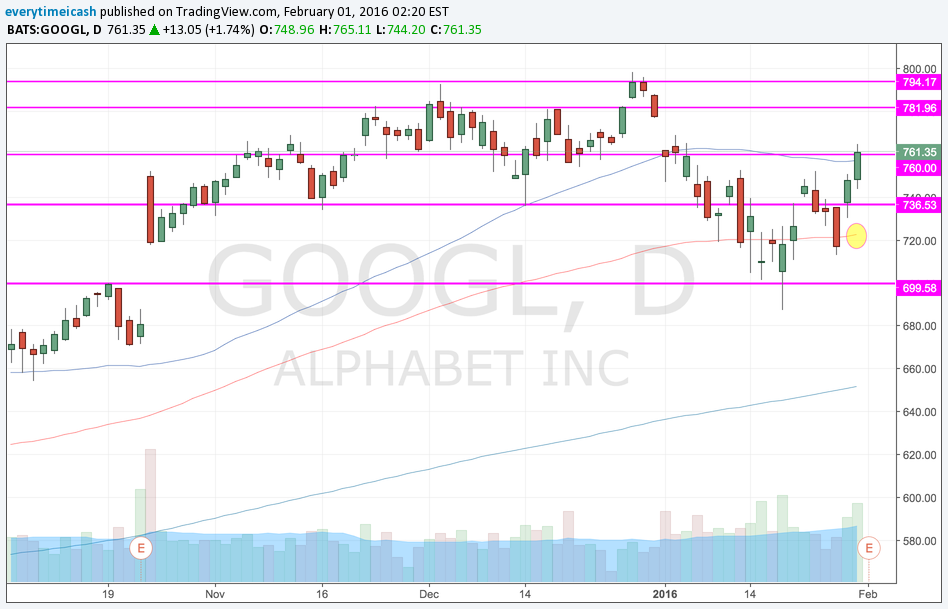
Alphabet, GOOG/GOOGL, just reported a beat in its most recent ER report and currently trades as the largest market cap company in the world today. This comes on the heels of a Facebook report that just crushed it, and an Amazon report that likely had Jeff Bezos silent for once. With that said, it's all systems go for the GOOG and it appears that their addition of Ruth Porat has changed the company's culture and impression on wall street to an "adult company."
Here are the #'s:
Alphabet beats by $0.58, beats on revs (752.00 +9.05)
Aggregate paid clicks- Q4 +31%; Q3 +22.8%:
Aggregate cost per click- Q4 -13%; Q3 -11%:
Revenue Segments:
This company just flexed its muscle and showed Wall Street (again) that it's not just some gimmick internet clicks company that can't turn profits. Furthermore, even at it's current valuation, the stock trades cheap ~20x forward and could create further room to the upside.
Investors continue to be rewarded for quality in the market even after wild swings that yield negative short term performance.
With its trend lines in tact, the measured move on this one suggest a 909 price target.
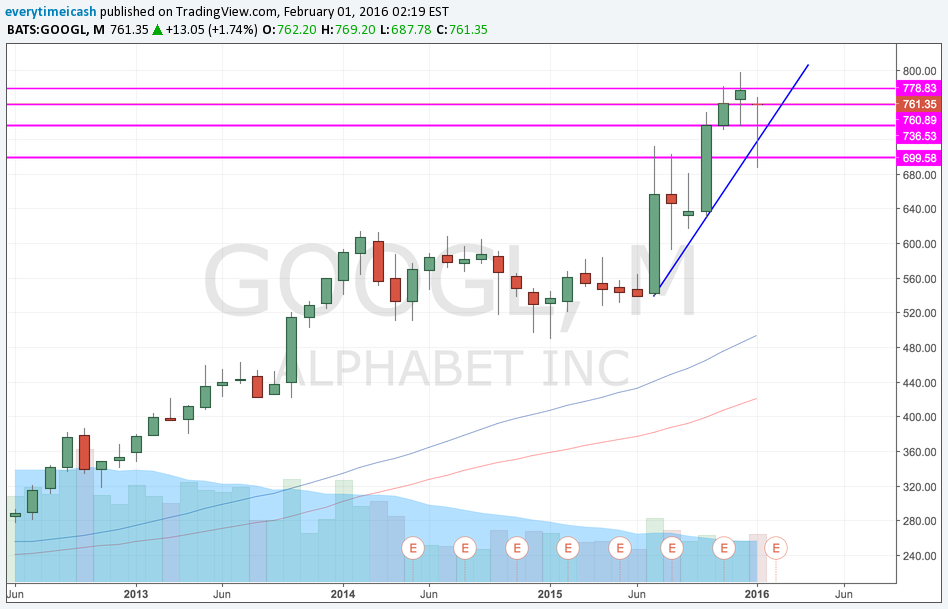

Even after a monster quarter by Facebook last week and the bar being set high, Alphabet was able to briskly hop over the expectations and deliver. An example of this is aggregate paid clicks which destroyed the streets estimates: (Aggregate paid clicks- Q4 +31%; Q3 +22.8%)
So what now for the stock? In the trade report put out yesterday we called for a +7% move in GOOG/GOOGL and a +$55 move in the issue. We were also long the weekly 760 C from last Wednesday and Next week 840/842.5 C.
I'd be a little surprised if this issue pressed like FB did. With market breadth nearing the top of a range and with this stock now the biggest market cap in the world, the law of large numbers does take effect at some point. On a longer time frame however I believe the trend is your friend and this company's new discipline and stellar performance should continue.
“Never permit speculative ventures to run into investments”
It goes without saying, even the least savvy market watcher can easily assert the correlation that oil and the markets as a whole have been trading in tandem. So when oil shot out of a cannon starting Thursday when it bottomed around 26.6 and moved all the way to 32/barrel it came as no surprise that it took the markets with it.
Whether it's up or down, it is human nature for market speculators to continue to try to find a bottom or a top in the current environment that were in. Speculation, in its most natural state, is done in such a way to avoid being the sucker. No one wants to be left holding the bag on the way up, and no one wants to miss the bounce on the way down. This peculiar, yet rather unfortunate state, is why we often see irrational buying when markets implode, and incessant top calling when markets sky. No man wants to be the "fool" in any/either circumstance.
Since the bounce in oil was all but telegraphed it puts the markets in an interesting position. It has been commonplace for oil and gas speculators to buy oil/gas when the weather gets cold and to cut it when weather gets warm again. So with the first blizzard of the year, and biggest one in years, combined with oversold conditions, risk in oil to the upside, and an overall market technical bounce, the bounce in oil futures was pretty much a "slam dunk."
Personally, I am of the mindset and the belief it is always best to avoid getting in the way of a train in motion (in this case oil moving lower). If you as a speculator believe that you can stomach whatever downside risk exists in oil, by all means have fun. From experience, I have learned that markets are significantly irrational and that they more than often overshoot beyond anyone's "rational" expectations.
With all that said, my bias on the overall markets currently is still bearish. That doesn't mean I am advocating blindly shorting, or suggesting that we are imminently going lower. I am simply looking at multiyear charts on multiple time frames in the SPY/SPX and CL_F and they still all look dismal.
This move lower in the markets in general was telegraphed by the transports in November of 2014 when the IYT topped out and began its imminent decline. (Not) Coincidentally, the WTI broke multiyear support that same month and has never looked back.
If we expand the charts to the start of the bull run in 2009 we notice that both these issues had stellar performances starting in 2009. The IYT advancing almost 400% (rough estimate) and WTI advancing nearly 335% (rough estimate again). The parallels here are fascinating with the most interesting caveat being that even with their sharp declines there is still room to run. Only recently did oil break its 2009 base bottom and the downtrend in the oil markets only calls for further downtrend in the IYT as shipping costs via trucking decrease in price with the falling price of gas.
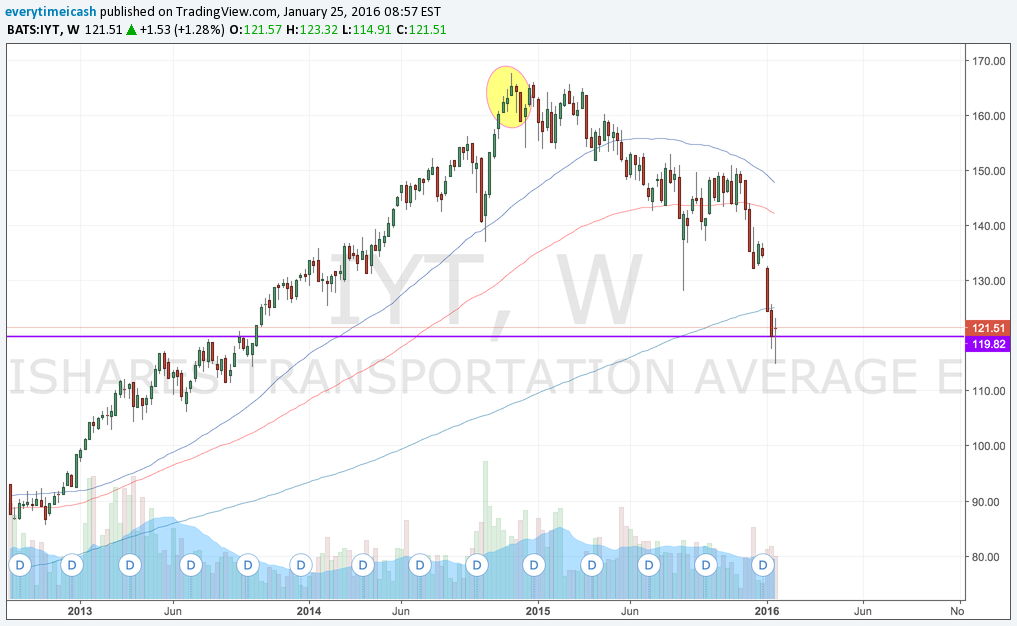

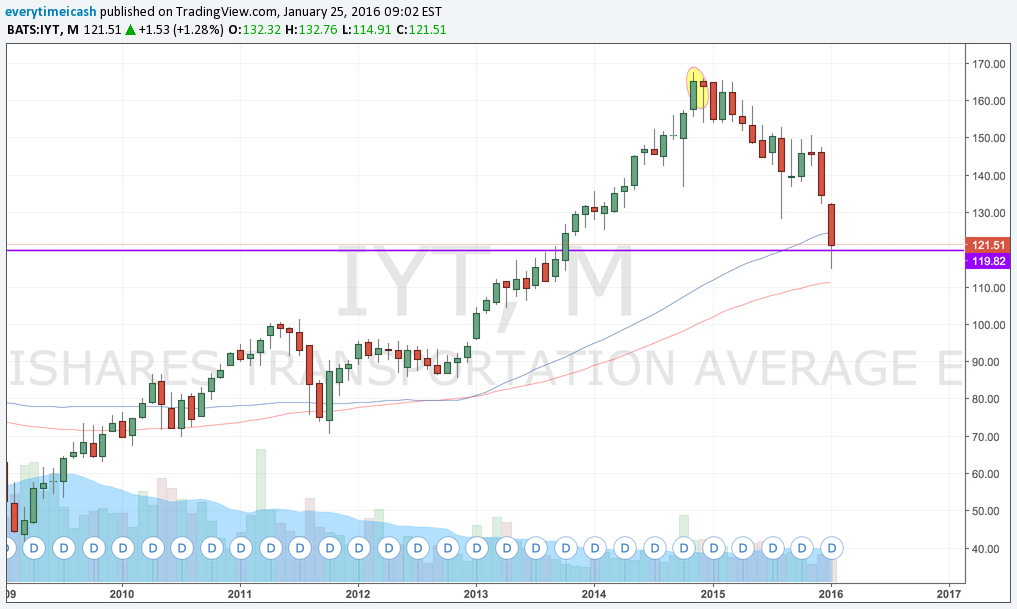
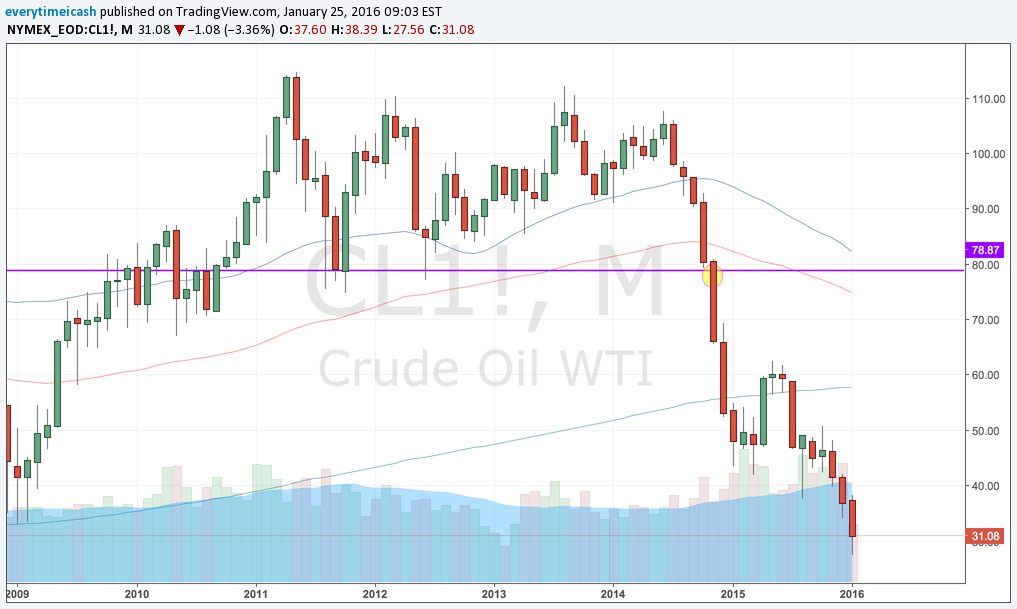
The main point I am making here is that trends don't happen overnight. Just like the IYT and WTI broke almost 1.5 years ago and we're only now reeling from their problems, a two day rally that was telegraphed doesn't reverse course. It is important to take things as they are, and to remain steadfast with the overall (larger) picture. My bias will remain negative on both oil and the markets so long as the larger picture for both these issues remains to the downside.
“Don’t trust your own opinion and always back your judgment until the action of the market confirms your theory.”
AS I write this U.S. index futures are getting obliterated. This comes in tandem of China's weaker yuan that has since created a rout in their equities just days before their Chinese New Year. This tumble has triggered their circuit breakers for the second time this week.
The ES_F index is down a little over 1% to 1961 on the lows. That's nothing in comparison to what's happening in China though where the Chinese stock exchanges shut down shop less than a half hour after they opened after the CSI 300 Index obliterated more 7% triggering another circuit breaker event.
The catalyst for the selloff in Asia comes after China's central bank cut its daily reference rate more than any other time since August. China's signaling to the rest of the world that they've got an increased threshold to do what it takes to shore up their weakening economic growth.
China puts everyone else on edge Jenga style.
We've seen an accelerated retreat from risky assets to start the new year. With the riskiest equities taking it on the chin first. The index as a whole has already seen a 2.4% haircut and will presumably end the day and week lower than that.
This is a classic real life scenario of the popular game Jenga. With different blocks coming off the whole group one by one. Unlike Jenga however, we don't actually need to see these blocks come down. Financial markets are operating in fear that the yuan's sharp depreciation may only accelerate, which would signal that China's economy is even weaker than everyone believed. If that's the case we could see a spark of another wave of devaluations around all of Asia and in other key countries/economies.
With Wall Street closing at three month lows on steady volume, the signal is clear. Risk aversion is on the board. Asset managers are getting out of the riskiest assets and avoiding another shoe dropping on them. This risk aversion was only amplified by the overnight plummeting price of oil and the geopolitical concerns behind North Korea's nuclear test on Wednesday evening. And now we get this shit. Fuckin' China.
Let's take a look at some levels.
SPX has been in a downtrend on the daily. 1973ish and 1954ish are the next lines int he sand.
Above you we see the S&P 500 levels and downtrend on a daily basis. Below we'll see it on a weekly basis.
SPX weekly
With all the turmoil and an absence of buyers in the market the bias remains to the downside. And with uncertainty as to how levered banks are and the level of exposure they may be facing when oil companies start going down this makes for a very troubled market situation. As I stated in the first post of the new year, the catastrophes that may lay buried underneath the oil madness are uncertain as of now and we should not try to pick bottoms. With a hint today that levels of credit default swaps in oil backed securities possibly being so high in some companies that bankruptcies and failures are nearly imminent, it goes without saying, get the fuck out the way.
It is quite obvious beyond that rhetoric that in some cases a chase for performance and growth may continue so it is my bias that we continue to trade opportunities to the long side as they present themselves while maintaining a downward bias.
“Patience is the key to success not speed. Time is a cunning speculator’s best friend if he uses it right.”
The market will make a fool out of anyone. Even when you are right, there will come a time where your patience is tested and you will subsequently question yourself. With the rush of bad news in Chipotle a few weeks ago you would have believed that the stock would be left for dead. The market was poised to make a mark out of anyone however and test the resolve of anyone who was waiting for damning news (myself included).
A little over a week ago I wrote about closing half of my $CMG positions. Not because I did not believe in all of the bearishness, but rather because the stock was not behaving how I would like. I also highlighted that we would wait for our cue to re-enter puts in the stock and play it for some more downside. A few days later we got our catalyst.
Jim Cramer had the Chipotle management on his show late last week. In the interview the CMG CEO told Cramer and his audience that the E.Coli scare has been contained and that it essentially would not trouble the company moving forward. The stock however, told a different story. The next day CMG gapped up into previous resistance and battled into the 10day yet again. From there, the stock sold off and continued to do so for three days. On that failure, I added to my existing position and used the high set as my stop.
CMG failed trend
With a little bit of luck, a lot of patience, and even more homework the trade did not present a failure or retest of trend of any kind. With the market's poor reaction to Aunt Yellen and her crew's rate hike decision the stock continued to prove a good one.
In Reminiscences of a Stock Operator the lead character Larry Livingston (Jesse Livermore's character) speaks on many occasion of being in a trade and watching the stock operators manipulate the stock. He comments on how he's been in the right trade and watched his paper profits all but evaporate. This is the scenario I found myself in prior to being given the opportunity to add to the position. There comes many times as a stock trader where your resolve will be tested. This scenario proved no exception. And with the price action staying consistent but the swings growing wild I would be lying if I told you I didn't question the trade. That said, the stock failed the highlighted level (again) and sure enough the weak tape was correct again as more E.Coli news circulated.
As important as it is to hold true to the setup it is equally important to take your profits when you are handed them. Without expecting any sort of news like this I/we would be foolish not to capitalize on this gift. With that said and with IV shooting through the roof I was able to clear off my books more than 40% of the position for stellar profits. The cost of the trade and then some was removed and I will continue monitoring the issue closely.
Here's a timestamped notice of the position and how it eventually turned out.

CMG position highlighted this morning.
Sign up for real time alerts, real time market insights, and real time actionable insights.
For the sake of keeping tabs, lets take a look at some important levels CMG will face moving forward.
CMG Weekly
With a dwindling consumer base many of these customers will have to go elsewhere. People still have to eat, you know? That said, it is plausible that CMG competitors Moe's and Q'doba see an uptick in traffic YoY. It's also very likely that other fast casual dining options start to get more volume. So with that said, let's take a look at both JACK and PNRA:
JACK Rangebound
PNRA Constructive
Between the two charts, it appears that JACK provides the cleanest setup to the upside as the issue has been rangebound for several months now. PNRA also sets up nicely above 200/share.
We will keep an eye on the issues moving forward and look for a continuation. As always if any of this has been helpful please comment/like/share.