Get Some Sun ($SCTY)

Comment

Get Some Sun ($SCTY)

Solar City (SCTY) is set to report Q4 results today after the close with a conference call to follow at 5pm ET.  

Current consensus stands at a loss of $2.59 per share on Revenue of $105.6 mln.

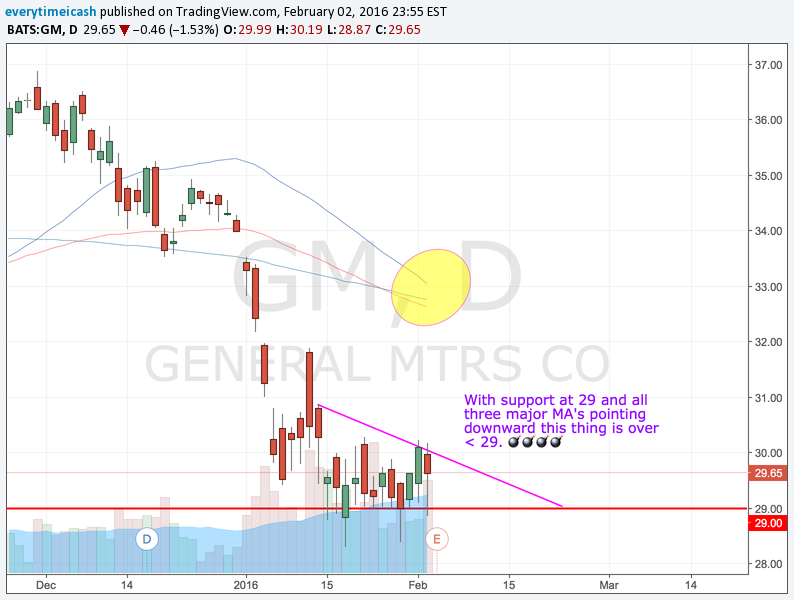
SCTY's stock has seen an aggressively wide range the last several years. It has traded down to multiyear support ahead of its report after trading near 40/share last quarter's report. It also was a stock approaching $60/share in December.

SCTY announced last earnings that it was switching from a growth tactic to cost cutting and cash flow. 

SCTY projected it would be cash flow break even by the end of 2016 and it will be important to show that the co will be able to hit these targets. The 52-week low will set up as a key support for SCTY as it will have to deal with what is likely to be a hefty top line miss.

Guidance

  • Installations of 280 to 300 MW in the fourth quarter. This would represent year-over-year growth of 58%-69% and would translate into full-year 2015 installations of 878-898 MW. This is below the low end of prior annual guidance.

    • Q4 2015 GAAP revenue guidance Operating Lease and Solar Energy Systems Incentive Revenue of $70-76 million, up 48% y/y; Solar Energy System and Component Sale Revenue is expected to range between $30-32 mln (Total Revenue guidance is $100-108 mln, Capital IQ consensus $117 mln).
    • Operating Lease and Solar Energy Systems Incentive Gross Margin is expected to range between 30% - 32%.
    • Non-GAAP Loss Per Share is expected to range between ($2.60)-($2.75), Capital IQ consensus ($2.15)
  • FY2016 Guidance Introduction
    • Co introduced preliminary 2016 guidance of 1.25 GW Installed, representing a y/y growth of ~41%.
    • SCTY expects to announce meaningful reductions to 2017 cost targets by this earnings call.
    • Expect to be cash flow break even by the end of 2016.

Q3 Recap

SCTY reported Q3 (Sep) loss of $0.20 per share, $1.74 better than the Capital IQ Consensus of ($1.94). Revenues rose 95.1% year/year to $113.85 mln vs the $111.43 mln Capital IQ Consensus.

  • Cost per Watt achieved a new record low of $2.84

  • PowerCo Platform
    • TTM Energy Production: 1.5 Terawatt-Hour (TWh), up 75% y/y
    • Cumulative MW Installed: 1,674 MW, up 86% y/y
    • Cumulative Customers: 298,030, up 77% y/y
    • Estimated Nominal Contracted Payments Remaining: $8.9 billion, up 115% y/y
    • Net Retained Value: $3.3 Billion, or ~$33 per basic share.
  • DevCo
    • Crossed Annualized Run Rate of 1 GW in Installations in 3Q
    • MW Installed: Record 256 MW, up 86% y/y; residential up 69% y/y;
    • MW Booked: 345 MW, up 50% y/y;
    • Net Increase in Nominal Contracted Payments Remaining: $1.2 billion, up 47% y/y;
    • DevCo Cost: $2.84 per Watt, down (2%) y/y;
    • Unlevered IRR: 12% forecast from Q3 2015 installations based on all-in costs including SG&A
    • Economic Value Creation: $239 Million forecast from our incremental Q3 2015 installations

BIAS: SELL


UPDATE


SolarCity beats by $2.63, beats on revs; guides Q1 EPS below consensus  (26.35 -1.59)

  • Reports Q4 (Dec) earnings of $0.04 per share, $2.63 better than the Capital IQ Consensus of ($2.59); revenues rose 60.8% year/year to $115.48 mln vs the $105.67 mln Capital IQ Consensus.
    • MW Installed: Record 272 MW, up 54% year-over-year (Guidance 280-300 MW)
    • MW Deployed: 253 MW, up 44% year-over-year
    • Value of MW Deployed under Energy Contracts: $3.64 per watt at a 6% discount rate ($3.32 per watt contracted and $0.32 per watt estimated renewal)
    • Cost per Watt: $2.71 per watt, down 5% year-over-year;
    • Asset Financing in Q4 2015: $2.40 per watt.
    • As of December 31, 2015, unrestricted Cash and Investments totaled $394 million, as compared to $418 million on September 30, 2015. The quarterly decline in cash of $137 million.
    • Residential has consistently performed above expectations over the last year, and missed guidance largely on commercial installations.
    • Going forward, plan on removing from guidance any large projects with construction deadlines late in the quarter

Comment

Un-Linked

Comment

Un-Linked


LNKD


LinkedIn beat the street's expectations by $0.16, reported revs in-line; guides Q1 and FY16 EPS and rev below consensus.

Here are the highlights: 


  • Reports Q4 (Dec) earnings of $0.94 per share, excluding non-recurring items, $0.16 better than the Capital IQ Consensus of $0.78; revenues rose 34.0% year/year to $862 mln vs the $857.26 mln Capital IQ Consensus.
  • Co issues downside guidance for Q1, sees EPS of ~$0.55, excluding non-recurring items, vs. $0.74 Capital IQ Consensus Estimate; sees Q1 revs of ~$820 mln vs. $866.50 mln Capital IQ Consensus Estimate.
  • Co issues downside guidance for FY16, sees EPS of ~$3.05-3.20, excluding non-recurring items, vs. $3.73 Capital IQ Consensus Estimate; sees FY16 revs of $3.6-3.65 bln vs. $3.91 bln Capital IQ Consensus Estimate. 
  • In the quarter, cumulative members grew 19% to 414 million, unique visiting members grew 7% to an average of 100 million per month, and member page views grew 26%. This yielded 17% year over year growth in page views per unique visiting member, continuing a pattern of strong engagement growth over the past several quarters. Mobile in particular grew 3x faster than overall member activity, and now represents 57% of all traffic to LinkedIn.

For the current numbers LinkedIn did okay. They beat the expectations and that's the name of the game. However this company trades on their growth and as with any growth stock, cutting your guidance and forward growth (especially in this environment) is bad news. 

Going into today's report LNKD traded at a forward P/E (FY Dec 31, 2016) of 52.39 and enterprise Value/EBITDA(ttm) 100.63. The enterprise value/EBITDA # is just stupid insane for any company. Investors in companies like this are ignoring this info and simply buying a stock on its potential growth. As long as a stock is growing, numbers like this will continue to be ignored. When a stock like LNKD reports #'s that revise their growth lower and show their MAU is stuck at 100M it is going to get obliterated. That is exactly what happened. 

From a technical standpoint, LNKD looks like this: 

From the weekly and monthly charts you can see LNKD has broken down in a head and shoulder fashion and is likely going to test its 2013 breakout point of around $120. 


FELICIA


LinkedIn has spent the last four years enjoying a rise and an acceptance by investors that they were investing in the future growth of this social media company. Talking head after talking head came on television to defend the stock claiming it's got great management and they can "pull many levers" to optimize the growth. Well, how's that working out for you assholes? Way to pump and dump all over the little guys, again. 

💯Bye Felicia 💯


Comment

Big DATA

Comment

Big DATA

Mizuho stays at Neutral, $80 tgt on DATA ahead of the results as they expect total revs of $218-225mm (+52-57% Y/ Y) vs consensus of $201mm and guidance of $195-200mm. Inline with the last few qtrs, mgmt guided 4Q15 significantly below normal seasonality. Since 2Q14, co has posted results $10-19mm above the upper end of mgmt's outlook. They expect similar performance given strong momentum and increased sales force productivity. Firm expects EPS of $0.22-0.24 vs consensus of $0.16. Also, checks indicate rising competition which may impact co's sales cycle going forward, and they expect mgmt is likely to raise 2016 outlook.


BIAS


With analysts giving them a pass and expecting the results to continue, IV cranked through the roof ($11 expected move) and with the rally today, I am a seller at these levels. The stock is sitting at a neckline for a longer term head and shoulders and I would not take my chances long here. 

BIAS: STAY NEUTRAL OR HARD SELL


UPDATE


Warned subscribers in the room about DATA and their high P/E. The stock's future hangs/hung on year over year revenue growth. The issue needed to show Wall St. that that the last two quarterly declines in revenue were anomalies and it was our bias that that was not the case. 


RESULTS


Reported Q4 (Dec) earnings of $0.33 per share, $0.18 better than the Capital IQ Consensus of $0.15; revenues rose 41.9% year/year to $202.8 mln vs the $200.66 mln Capital IQ Consensus.

  • License revenue grew to $133.1 million, up 31% year over year.
  • International revenue grew to $53.7 million, up 63% year over year.
  • Added more than 3,600 new customer accounts.
  • Closed 414 transactions greater than $100,000, up 36% year over year.

On the outside, this looks like a beat and a good report. 

THIS REPORT SUCKS

This stock received a high multiple based on their growth. If you focus on their revenue rise (41.9%) it is 33% less than the last (2) quarters. This shows a shocking deceleration in growth and you see that displayed right now with the equity price (~34% decline). Hate to break it to you, but this high growth name is OVER.

Previous ER showing Rev Yr-Yr


OUR TRADE


If you're in the Feb/Mar 75 puts with us congrats. Use tomorrow as an opportunity to sell and lock your profits and look to roll out to march as the issue will more than likely touch it's IPO lows. 


Comment

White Flag! White Flag! White Flag!

Comment

White Flag! White Flag! White Flag!

Don’t give me timing, give me time.
— Jesse Livermore

The most common theme I see from traders is when they are in a "slump" and want to break that habit and move forward in their trading. As a trader it is important to know that we are all human and we all fuck up. We buy the highs and we sell the lows, we compound our problems and overanalyze. We miss trades, we overtrade, and we don't take trades. The above should resonate with you, if it doesn't you're a fucking liar, go away. 

I'm often asked:

"What do I do to change my trading? How can I be profitable (again)?"

I'm asked this so often in fact that I'm going to dedicate a post to it. 


Relax...


The craziest thing about the stock market is its ability to mind fuck you repeatedly. If you trade long enough you will find that you run the gambit of emotions. From frustration, rage, anger, happiness, euphoria, annoyance, fatigue, and many others this market will eat you alive if you let it.

The first thing you should do as a trader is learn to keep a level head and relax. You need to be as level headed as you possibly can be. Practice never getting too up and never getting too down. Your wins are not your own doing. The market is built on fundamental odds/statistics and it is your job as a trader to check your emotions, mitigate your risk, and position yourself (relative to your own risk tolerance) for optimal success. 

If you can temper your expectations and your emotions you will be well ahead of the curve.


HOMEWORK


Hate to break it to you but if you're playing the markets for a "Get rich quick" situation, you should just quit now. Save your money, buy something wasteful, go on vacation, start a business, whatever, just don't waste it on the markets. In order to be good at this business, you must be able to adapt quickly to scenarios you did not expect. That takes hours and hours of analyzation, pattern recognition, and discipline. Sure, when you're right the markets will print cash for you like an ATM gone haywire, but it will take the time you're not trading to get you to that place. 


FIRST THINGS FIRST


The very first thing you should do when you're struggling or going through a trading drought is absolutely nothing. That's right, I said nothing. Let me go into detail behind the mindset here.

From my experience, I've realized that most major losses I've had have come from reckless trading and/or trying to make up for losses I'd had. I've learned that when I'm on a "bad streak" it's best to initially ratchet down my position size. If this does not work, I will simply study the market and make notes of entries and exits and see how I "would have" done. If that doesn't work, and I'm just way out of touch, I will just shut it down. I will take a day, two, three whatever it takes to just reset. If I return and I am still not getting in sync, I will simply just shut down again. I will continue this practice until I feel mentally prepared to take on the rigors of day to day decision making. 


HARD REBOOT


Since the market leaders often change, I find it best for my style to keep a primary list of about thirty stocks at any one time. This doesn't mean that I don't chart or track other stocks, but simply on a day in and day out situation I will track a list of about thirty stocks that I feel comfortable with. This list will change given market sentiments and breadth. 

If we are bearish, my list will consist of stocks that I primarily want to short on breakdowns. The opposite, of course, is also true. Sometimes my lists just are not in sync with the market itself. Nothing on my list will stand out. In that case, I will erase the entire list. 

Thats right, I will erase the whole list and start from scratch. Since I am a momentum trader primarily, I will scan through charts and find where I think the momentum is going. Once I've found this, I will ONLY (I cannot stress this enough) add the strongest stocks that fall in line with the market in general. I will not watch the bullshit (GPRO FEYE etc). I will stick to the top shelf stuff. 


LAST CALL


The last thing I want to stress is when things don't go your way it is very important that you keep your cool. Not keeping your cool can really fuck you. Trading is all about mastering the mental and emotional battle with yourself more than anything. It is paramount in my opinion to relieve the outside stresses you face and not let them spill over into your trading. Doing this will help your results. It is also important to be very honest with yourself. You need to make judgments about when things are not going your way and take the adequate time to rebalance. 

Remember, the markets will always be there. There is no reason to rush things. 


Comment

I Can Be Your Hero Baby

Comment

I Can Be Your Hero Baby


GPRO Earnings Preview


GoPro (GPRO) is set to report Q4 results tonight after the close with a conference call to follow at 5pm ET. GPRO reported Q3 results at 4:04pm and then provided it's Q4 guidance in a presentation released shortly before its conference call. Current Capital IQ consensus stands at EPS of $0.03 on Revenues of $448 mln.

Shares of GPRO have remained mired in the $10 level. The stock was hammered when it preannounced a disappointing Q4 on January 13. This was on the heels of a poor Q3 report (that included disappointing Q4 guidance at the time). GPRO has been hampered by its launch of its HERO4 Session which has seen it cut prices in order to spur demand. This has led to fears that the company's original innovation has run its course. Worries about low barriers of entry also remain.

GPRO still holds its content but that has hardly been enough to placate investor fears. Investors will want to see how sales have been progressing over the past three weeks and will be paying particular attention to inventory levels.

January Preannouncement

  • GPRO preannounced results on January 13, cut its work force by 7% and announcement management/board changes
  • GPRO lowered Q4 rev to $435 mln from $500-550 mln vs. then-$507.8 mln consensus.
    • Q4 revenue reflected lower than anticipated sales of its capture devices due to slower than expected sell through at retailers, particularly in the first half of the quarter.
    • Fourth quarter revenue includes a $21 million reduction for price protection related charges resulting from the HERO4 Session repricing in December.
  • GPRO lowered non-GAAP gross margin to 34.5-35.5%from 45.5-46.5%.
  • GoPro implemented a reduction in its workforce of ~7 percent. The Company estimates it will incur ~$5-10 mln of restructuring expenses in Q1.
  • Zander Lurie resigned from his role as Senior Vice President of GoPro Entertainment and has been appointed to serve on GoPro's board of directors.

Key Metrics

  • Units Shipped- Q3 was 1583 which was down 3% q/q
  • Inventory- Increased 32% q/q to $289 mln on the heels of the disappointing HERO4 launch.
    • Inventory Turns was 3.4x compared to 2.7x in Q2
    • Inventory Days was 122.3 compared to 87.7 in Q2. 

Q3 Recap

  • GPRO reported Q3 (Sep) earnings of $0.25 per share, $0.04 worse than the Capital IQ Consensus of $0.29. Revenues rose 43.0% year/year to $400.34 mln vs the $431.48 mln Capital IQ Consensus.
  • Gross Margin 46.6%, Guidance 45.5-46.5%; Q2 46.4%
  • The Board of Directors of GoPro authorized the Company to repurchase up to $300 million of its Class A capital stock, commencing in the fourth quarter of 2015.

YOU PLAYED YOURSELF


GoPro (halted) just missed by $0.11, rev in-line with warning; guided Q1 revs well below consensus; guided FY16 revs below consensus; names Brian McGee CFO .

  • Reports Q4 (Dec) adj. loss of $0.08 per share, $0.11 worse than the Consensus of $0.03; revenues fell 31.1% year/year to $436.6 mln ($448.56 mlnConsensus); gross margin 29.6%.

  • GPRO Warned on Jan 13: Lowered Q4 rev to $435 mln from $500-550 mln; non-GAAP GM to 34.5-35.5% from 45.5-46.5%.


This story continues to get ugly for the camera maker and their CEO Nick Woodman. Non-GAAP gross margin was impacted by a charge of ~$57 mln to cost of revenue for excess purchase order commitments, excess inventory and obsolete tooling resulting from the Company's decision to discontinue production of the HERO cameras.

This charge is greater than the $30-35 mln that co warned about in January.

  • The company issues downside guidance for Q1, sees Q1 revs of $160-180 mln vs. $300.67 mln Capital IQ Consensus; non-GAAP gross margin 35-37%.
  • Co issues downside guidance for FY16, sees FY16 revs of $1.35-1.50 bln vs. $1.63 bln Capital IQ Consensus Estimate. 
  • Commencing in the fourth quarter of 2015, GoPro has acquired ~1.5 million shares of its Class A capital stock at an average price per share of approximately $23.05.

FUGLY


No matter how you slice it, this quarter was fucking ugly. If you are bullish you're either "punting" or you're blind. To slash estimates the way they did a month ago and follow up with this bullshit which is significantly worse than what they said just a month ago shows a very poor management at hand. 

The derivative to this is Ambarella which will be taken to the woodshed in sympathy for Mr. Woodman and his staff's incompetence. 


BIAS: Don't play yourself. HARD SELL -- Shit performance, shit management, shit "new products". An acquisition is their only way out at this point. 


Comment

What's Cookin'?

Comment

What's Cookin'?


Non-Manufacturing ISM


In the past the non-manufacturing ISM didn't draw many eyeballs. However, with the ISM manufacturing index coming in <50.0 the last four months, bulls are looking for any signs of life that will give the economy a justified boost. 

I don't mean to belittle this report as the majority of business industries in the U.S. are not manufacturing. We are in fact a "service based economy" at this point. This report will be important as it gives a read through to employment and pricing in non-manufacturing based industries. This read through actually does have a wider and more important meaning for the labor markets. 

Some important things to remember: 

  • Growth in the non-manufacturing sector has been slowing since July
  • ISM manufacturing index has been <50 for four straight months
  • Investors are worried and will watch for any spillover from ISM manufacturing 
  • The dividing line between expansion and contraction is 50.0
  • Trends in this report can influence the markets thoughts about Fed's path toward "policy rate normalization"

This report impacts the following:

  • TLT
  • TBT
  • SHY
  • IEF
  • SPY
  • QQQ
  • DIA
  • EUR/USD
  • USD/JPY

Jobbin'


ADP Employment numbers are also due out at 8:15 EST. Consensus numbers are somewhere around the 190k Jobs number. This would be lower than the prior number of 257K. On the low side a number greater than 180K jobs should keep things "okay" for the markets. 


Who the Fuck Said Anything About Oil? Bitch, You Cookin?


Oil will continue to dominate the trading screens as the $CL_F closed sub <30 for the first time since it bottomed and rallied from the mid 26 level. Crude inventories will be released at 10:30 a.m. EST. The prior number too look for/compare against is 8.383M barrels.

Comment

Murican Made Car Bomb ($GM)

Comment

Murican Made Car Bomb ($GM)

There is nothing new on Wall Street or in stock speculation. What has happened in the past will happen again, and again, and again.
— Jesse Livermore

The fact that Wall Street repeats its same mistakes over and over again is nothing new. We are human and we are wired the same. If you're monotheistic religious believer or if you're just spiritual the fact greed and self serving is not a new concept to you when it comes to human nature. In religion this is seen early in the story of human creation with the story of Adam and Eve. In life, this takes form over and over again; especially on Wall Street. 

The markets have seen a steady rise for the last seven years on the heels of the largest credit crisis we've ever experienced. Banks packaged loans and sold them to other banks which eventually cratered the basis of the economic system. Now we're starting to see similar patterns in the markets which are usually a 6-8 month foreshadowing of the general/broader economy. So our goal here is to figure out, is it over, did it just begin, or possibly something else. 


CREDIT DEFAULTS


I am a believer that we may have the largest debt default in market history. That said, I want to talk about the pattern of defaults, specifically as the relate to corporate bond markets. 

To put it simply, the cycle is usually like this -- Defaults on "speculative" bonds are <5% (basically less than 5% of non-investment grade US corporate bonds default in a year). When we break the 5% mark we (historically) get a three or four year rising, peaking, and then normalization. This is how a "normal" credit cycle usually works. It's healthy. People come up with ideas, turn into business founders, get money, go bankrupt. Rinse and fuckin' repeat. 

Look back in time you see this cycle play itself out over and over again. (See below)

  • 1990: Defaults pop from 4% to 8%. In 1991 they peak at ~11% then they decline reaching 6% in 1992. 1993, crisis averted and we go back to normal around 3%. About $50Billion in corporate debt goes into default
  • 1999: Machine goes on H.A.M. again, default blast 5+% and then ramp through 2001 hitting 9ish%. Then they start to normalize around 2002 and everything back to normal in 2003.
    • This time the junkies had much more debt than 1990. About 10x more -- $500Billion lost in default. This growth in risk was because of the love of the CDS market.
  • 2009: Mortgage crisis starts stinking up every fuckin thing it touches. Defaults power to 10%. This time it was different though. The Fed steps in and stops the cycle dead in its tracks. "Too big to fail" become commonplace and inject some cash steroids into the markets. 
    • $1 TRILLION in debt goes into default (even with the Fed band aid)

Remember though, markets USUALLY go through this cycle where they default, peak, crash and fuckin burn then normalize. The weak die the strong survive and it's c'est la fuckin vie all over again. However in 2009 Uncle Ben and his cronies stopped this normalization process. They stopped it dead in it's tracks and allowed the weak to survive and prevented the crash and normalization. Because of that they "avoided" TRILLIONS of dollars of debt from finding its way back to normalization. They wrote that shit off like it never happened and started pumping money back into the economy, business as usual. 


QUICK EXAMPLE


Let me give you a quick example of how you can relate the above mentioned "Fed injection". Think of a person that has a compulsive credit problem. They take out a card, start using the shit out of it notice it's running low so they repeat the problem. Eventually they run up like 7 credit cards and realize "Fuck, I can't pay this off." 

In this example, if it were a normal situation this person would likely default on paying the cards off and probably file bankruptcy or get a second job and pay things down -- lesson learned though. 

Imagine this person has a really rich mom/dad and that parent steps in and is like "Ok, I'll pay this off for you don't ever let it happen again." In this case the person never really learned how big their issue was and never really "fixed" the problem. Their parent (Fed) stepped in and paid off the debts and they went back to business as usual.


BACK TO CDS PROBLEM


Because we never had our "debt clearing" situation in 2009, the Fed basically pressed "pause" on the impending doom and gloom. Basically we got a weak recover and an economy that's still heavily leveraged and debt dependent. "Business as usual." 

So because that debt never "cleared" or "flushed" out of the system, we face a catastrophic debt obligation the next time "shit hits the fan." The main question is


 "When does shit usually go bust?" 


If you look above, the credit cycle usually starts up 6 years after it normalizes. (1999, 2009). Let's count up the years since we cleared our debt obligati-- Oh shit, we'er on the sixth year. 

In 2006 we had our best year for speculative corporate debt in recent history. Two years later, well you already know what happened. The best since that time was in 2014, and well we're now in year two since then. Let's examine the estimates quickly:

  • High yield experts say "base-case scenario" is between $1.6 trillion and $2 trillion in high yield bond defaults. 

Personally, I don't like the conservative estimates because, well, Wall Street is full of greedy fucking money addicts and CDS markets make the size more catastrophic then the base. 


THE TELL


In the mortgage crisis, the first tell you had of anything going bad was the default of sub-prime housing loans. So, it goes without saying that we'll check the sub-prime loan market to see if anything sucks there first.

Without doing much digging, we learn two loan markets have ballooned since 2008; Student and Auto loans. 

Let's focus on autos. Every other day you hear some talking head tell you about how auto sales are at peak and record levels. Did people have a bunch of money left over since 2008 and just decided to "treat themselves?"

Short answer: No. Auto loan origination has boomed on a serious drop in lending standards. Not surprising in this junk you find sub-prime lending to people with bad or zero credit and no income. 


HOW'S THIS HAPPENING?


Without getting too bogged down with details there's only one simple answer to this; cheap money. The Fed's zero interest rate policy has opened the door for a swoon of raiders to capitalize on the creation and origination of cheap money bad loans. This cheap money gives auto loan originators an interesting dynamic. They basically get "fixed" retail prices and they have high variable costs. When the cost of capital is cheap they pioneer stellar results and when the costs increase they suffer immensely. 

Just like the mortgage crisis, we have yet another issue of subprime auto backed assets. Auto ABS for short. (Emphasis on "BS") We now have more than $20B in subprime Auto ABS. These loans are packaged repackaged and grouped with tons of other loans adding "extra credit protection". The risks are offset with the belief in a "large number is less risky than a small number of loans." 

Without going all "gloom and doom" on you with the ABS market I want to focus on GM. Just know that packaging debts over and over again, especially badly lent debts, is a shit idea and almost never goes well. 


MURICAN CAR MAKER


GM is a low-margin auto manufacturer that is dependent on cheap money for the sake of their business model. In a low rate and high auto sale environment you would expect this stock to perform favorably. That has not been the case however as the company is heavily in debt and little cash flows have been spent on paying off governments and unions. 

GM is also, one of the largest owners of sub prime auto loans. The other largest player in auto finance is Santander Consumer USA ($SC), That issue (SC) has already begun its woodshed beating. 

All subprime auto businesses operate the same way. They maintain margins that make up ~3% of their loan books. That means if their funding increases marginally their profits are depleted. 

GM pays 3% for the capital is uses and earns ~12% on the subprime auto loans it dishes out. After everything is all said and done, their operating margin is 3%. The main point to take away is the small size of the operating margins after all is said and done. Remember that at the end of the day GM has been the beneficiary of cheap access to capital. That cheap capital allowed them to make bad loans and take out more cheap access to capital and more bad loans. We're at a "Peak" in auto sales, have cheap cash available, and at the end of the day they make a 3% operating margin. 

As the Fed increases interest rates, these already low operating margins will get wiped. Furthermore, loan losses are going to go through the fuckin' roof because of weak regulatory actions that make it more difficult for companies to be able to repossess cars.

GM, like other companies have found new ways to avoid "delinquent" loans on their books. They now offer customers the ability to defer their loans. I want to point out that many of these loans are subprime and already have a long life cycle (6-8 years in many cases). If we put this simply, you got a company that borrows cheap money, turns around and loans it out with a higher rate, then they allow the people borrowing that money that can't pay it back to put it on "pause." They then can avoid pointing to the toxicity of the loans and the books stay "clean." Yeah, that's not going end badly at all. 💣💣💣💣💣

Aside from this nightmare scenario, GM (financial) debt-to-asset ratio is 80%. As long as interest rates remain zero (which they haven't) GM can continue to pay off their debts. Now that the cost of borrowing capital has risen, their ability to repay their debts should suffer. 


GET TECHNICAL


Even with access to cheap capital, peak auto sales, and a "lack of delinquencies" GM can't seem to arouse investors and perk its stock price. It's currently sitting at major support for the issue and it barfed to 20 the last time the 29 level broke. We want to short this piece of shit to the ground if that 29 level breaks. 


Comment

Easy as ABC

Comment

Easy as ABC

Successful trading is always an emotional battle for the speculator, not an intelligent battle.
— Jesse Livermore

Alphabet, GOOG/GOOGL, just reported a beat in its most recent ER report and currently trades as the largest market cap company in the world today. This comes on the heels of a Facebook report that just crushed it, and an Amazon report that likely had Jeff Bezos silent for once. With that said, it's all systems go for the GOOG and it appears that their addition of Ruth Porat has changed the company's culture and impression on wall street to an "adult company." 

Here are the #'s:

Alphabet beats by $0.58, beats on revs  (752.00 +9.05)

  • Reports Q4 (Dec) earnings of $8.67 per share, $0.58 better than expected of $8.09; revenues rose 18.5% year/year to $21.33 bln vs the $20.76 bln Capital IQ Consensus.

Aggregate paid clicks- Q4 +31%; Q3 +22.8%:

  • Paid Clicks on Google websites- Q4 +40%; Q3 +35%.
  • Paid clicks on member sites- Q4 +2%; Q3 -5%.

Aggregate cost per click- Q4 -13%; Q3 -11%:

  • CPC on Google sites- Q4 -16%; Q3 -16%.
  • CPC on member sites- Q4 -8%; Q3 -4%.

Revenue Segments:

  • Google Website revenue +20% y/y
  • Google Network Member websites +7% y/y
  • Google Advertising +17% y/y
  • Google Other Revenues +24% y/y
  • Operating Expense as % of revenue 36% compared to 37% in prior year
  • Free Cash Flow $4.31 bln compared to $2.81 bln in prior year
  • TAC As a % of revenue 21% compared to 22% in prior year

This company just flexed its muscle and showed Wall Street (again) that it's not just some gimmick internet clicks company that can't turn profits. Furthermore, even at it's current valuation, the stock trades cheap ~20x forward and could create further room to the upside. 

Investors continue to be rewarded for quality in the market even after wild swings that yield negative short term performance. 

With its trend lines in tact, the measured move on this one suggest a 909 price target. 


EXPECTATIONS


Even after a monster quarter by Facebook last week and the bar being set high, Alphabet was able to briskly hop over the expectations and deliver. An example of this is aggregate paid clicks which destroyed the streets estimates:  (Aggregate paid clicks- Q4 +31%; Q3 +22.8%)

So what now for the stock? In the trade report put out yesterday we called for a +7% move in GOOG/GOOGL and a +$55 move in the issue. We were also long the weekly 760 C from last Wednesday and Next week 840/842.5 C. 

I'd be a little surprised if this issue pressed like FB did. With market breadth nearing the top of a range and with this stock now the biggest market cap in the world, the law of large numbers does take effect at some point. On a longer time frame however I believe the trend is your friend and this company's new discipline and stellar performance should continue. 


    Comment

    Snow Day

    Comment

    Snow Day

    With a large portion of the east coast snowed in today and this past weekend the oil markets received an anticipated boost heading into the weekend. That said, oil's 13+% rally in just two sessions was eased heading into todays session. With traders taking their risk off the board and with the SPX making a technical bounce, some investors were quick to call a temporary bottom in oil. As I type this however, oil is making session lows and looks to test the 30 level shortly. One of two events needs to occur for bullish traders on this busy week. 

    1. Oil and the markets diverge and subsequently trade independently of one another (unlikely)
    2. Oil actually finds a temporary bottom and buyers step in with a little more conviction

    BUSY WEEK


    This weeks busy earnings season kicked off with McDonalds (MCD) and Halliburton (HAL) beating street estimates. However for HAL North American revenue declined by about 28% year over year and operating income dropped from $5.1 billion to an operating loss of $165 million. This read through gives us a term that we've grown all too familiar with; "Revenue recession." 

    D R Horton (DHI) Posted a beat on earnings with a slightly higher-than-expected profit along with a rise in orders for the last quarter of the year. However, investors focused on DHI's growth rate which was the slowest since the fourth quarter in 2011. Even with earnings providing themselves as a catalyst of sorts, equities can't seem to get out of their own way as investors line up to exit stage left. 

    Tomorrow we get a further read as P&G, J&J, Coach, and 3M give us their results in the morning. At&t, Capital One, Stryker, and of course Apple cap off the evening. That sets us up for a Wednesday which includes a myriad of more earnings reports and a Fed Statement that should keep everyone on their toes. 


    800 LB Gorilla Named AAPL


    AAPL is set to release numbers on Tuesday night after the bell amid a horrible tape and an underperforming issue since failing near its top in July. Everyone and their brother has an opinion on this stock and the issue has not been able to get out of its own way for months. 

    Since July, the stock has seen its price cut by over 33% falling as low as $93 (excluding flash crash in August). With that fall, and with analysts slashing targets (albeit not dramatically) the stock finds itself in a peculiar place. Either analysts need to revise their estimates more and slash their targets even more dramatically, or AAPL is unfairly being discounted relative to the market because investors are no longer seeing it as a beacon for growth. If we strip all of that out and strictly look at AAPL as a technical play, here's what we get. 

    With the stock in a downtrend and a head and shoulders on the monthly and weekly, there really hasn't been much reason to own AAPL for the last half year. The stock has however presented an opportunity with the $93 test from last week. The test of the 93(ish) level was the 2012 high and a solid retrace back to it from all time highs. Coincidentally, on that test AAPL also gave a 50% retrace from the bull run it's enjoyed since 2013. In addition, the monthly 50MA sits just below that level at ~$90. With all these indications, and a refresh cycle year for the iPhone, it would be foolish to remain staunchly bearish on this beast. If you can afford it, a risk reversal would be an interesting way to play this name heading into earnings. 

    AAPL Monthly head and shoulders but sitting right above the 2012 high retest support

    50% RETRACE

    BIAS: Bullish with 92 stop (or 90 if your tolerance/timeframe is higher)


    Comment

    Beta Fishing

    Comment

    Beta Fishing

    Never permit speculative ventures to run into investments
    — Jesse Livermore

    It goes without saying, even the least savvy market watcher can easily assert the correlation that oil and the markets as a whole have been trading in tandem. So when oil shot out of a cannon starting Thursday when it bottomed around 26.6 and moved all the way to 32/barrel it came as no surprise that it took the markets with it. 

    Whether it's up or down, it is human nature for market speculators to continue to try to find a bottom or a top in the current environment that were in. Speculation, in its most natural state, is done in such a way to avoid being the sucker. No one wants to be left holding the bag on the way up, and no one wants to miss the bounce on the way down. This peculiar, yet rather unfortunate state, is why we often see irrational buying when markets implode, and incessant top calling when markets sky. No man wants to be the "fool" in any/either circumstance. 

    Since the bounce in oil was all but telegraphed it puts the markets in an interesting position. It has been commonplace for oil and gas speculators to buy oil/gas when the weather gets cold and to cut it when weather gets warm again. So with the first blizzard of the year, and biggest one in years, combined with oversold conditions, risk in oil to the upside, and an overall market technical bounce, the bounce in oil futures was pretty much a "slam dunk." 

    Personally, I am of the mindset and the belief it is always best to avoid getting in the way of a train in motion (in this case oil moving lower). If you as a speculator believe that you can stomach whatever downside risk exists in oil, by all means have fun. From experience, I have learned that markets are significantly irrational and that they more than often overshoot beyond anyone's "rational" expectations. 

    With all that said, my bias on the overall markets currently is still bearish. That doesn't mean I am advocating blindly shorting, or suggesting that we are imminently going lower. I am simply looking at multiyear charts on multiple time frames in the SPY/SPX and CL_F and they still all look dismal. 


    DEEP SEA FISHIN'


    This move lower in the markets in general was telegraphed by the transports in November of 2014 when the IYT topped out and began its imminent decline. (Not) Coincidentally, the WTI broke multiyear support that same month and has never looked back. 

    If we expand the charts to the start of the bull run in 2009 we notice that both these issues had stellar performances starting in 2009. The IYT advancing almost 400% (rough estimate) and WTI advancing nearly 335% (rough estimate again). The parallels here are fascinating with the most interesting caveat being that even with their sharp declines there is still room to run. Only recently did oil break its 2009 base bottom and the downtrend in the oil markets only calls for further downtrend in the IYT as shipping costs via trucking decrease in price with the falling price of gas. 


    TAKEAWAY


    The main point I am making here is that trends don't happen overnight. Just like the IYT and WTI broke almost 1.5 years ago and we're only now reeling from their problems, a two day rally that was telegraphed doesn't reverse course. It is important to take things as they are, and to remain steadfast with the overall (larger) picture. My bias will remain negative on both oil and the markets so long as the larger picture for both these issues remains to the downside. 

    Comment

    Red State

    Comment

    Red State

    Don’t trust your own opinion and always back your judgment until the action of the market confirms your theory.
    — Jesse Livermore

    AS I write this U.S. index futures are getting obliterated. This comes in tandem of China's weaker yuan that has since created a rout in their equities just days before their Chinese New Year. This tumble has triggered their circuit breakers for the second time this week. 

    The ES_F index is down a little over 1% to 1961 on the lows. That's nothing in comparison to what's happening in China though where the Chinese stock exchanges shut down shop less than a half hour after they opened after the CSI 300 Index obliterated more 7% triggering another circuit breaker event. 

    The catalyst for the selloff in Asia comes after China's central bank cut its daily reference rate more than any other time since August. China's signaling to the rest of the world that they've got an increased threshold to do what it takes to shore up their weakening economic growth. 


    JENGA

    China puts everyone else on edge Jenga style.


    We've seen an accelerated retreat from risky assets to start the new year. With the riskiest equities taking it on the chin first. The index as a whole has already seen a 2.4% haircut and will presumably end the day and week lower than that. 

    This is a classic real life scenario of the popular game Jenga. With different blocks coming off the whole group one by one. Unlike Jenga however, we don't actually need to see these blocks come down. Financial markets are operating in fear that the yuan's sharp depreciation may only accelerate, which would signal that China's economy is even weaker than everyone believed. If that's the case we could see a spark of another wave of devaluations around all of Asia and in other key countries/economies. 

    With Wall Street closing at three month lows on steady volume, the signal is clear. Risk aversion is on the board. Asset managers are getting out of the riskiest assets and avoiding another shoe dropping on them. This risk aversion was only amplified by the overnight plummeting price of oil and the geopolitical concerns behind North Korea's nuclear test on Wednesday evening. And now we get this shit. Fuckin' China. 


    LINES


    Let's take a look at some levels. 

    SPX has been in a downtrend on the daily. 1973ish and 1954ish are the next lines int he sand. 

    Above you we see the S&P 500 levels and downtrend on a daily basis. Below we'll see it on a weekly basis. 

    SPX weekly


    DOWN DOWN DOWN


    With all the turmoil and an absence of buyers in the market the bias remains to the downside. And with uncertainty as to how levered banks are and the level of exposure they may be facing when oil companies start going down this makes for a very troubled market situation. As I stated in the first post of the new year, the catastrophes that may lay buried underneath the oil madness are uncertain as of now and we should not try to pick bottoms. With a hint today that levels of credit default swaps in oil backed securities possibly being so high in some companies that bankruptcies and failures are nearly imminent, it goes without saying, get the fuck out the way. 

    It is quite obvious beyond that rhetoric that in some cases a chase for performance and growth may continue so it is my bias that we continue to trade opportunities to the long side as they present themselves while maintaining a downward bias. 

    Comment

    SOAK IT IN

    SOAK IT IN

    There is nothing new on Wall Street or in stock speculation. What has happened in the past will happen again, and again, and again. This is because human nature does not change, and it is human emotion, solidly built into our human nature, that always gets in the way of human intelligence.
    — Jesse Livermore

    I really hate the new year. It's the one time of the year where everyone is excited for nothing. The day where pundits get more insane, people really believe they'll change over night, and tension to have an epic night are higher than a Klan rally in a south Chicago ghetto. I typically hate hearing people's predictions in general for the same reason I hate twitter; as Lewis Black puts it, "Where do you get the massive ego that anybody actually gives a shit". 

    As a trader, the new year especially sucks. Everyone feels like they need to give you some bullshit arbitrary "fact" and toot their own horn. I hate to pick on Jim Cramer (frankly it's just too easy these days) but I recently read his outlook for 2015. Long story short he suggested that 2015 would be the best year to own stocks. I parsed through his predictions of Dow stock performances in 2015 as well. Here's what we found. You can compare these with the actual results here.

    • INTC    +35%

    • UNH    +20%

    • HD    +40%

    • MSFT    +15%

    • CSCO    +22%

    • DIS    +13%

    • NKE    +6%

    • V    +8%

    • MMM    +12%

    • TRV    +25%

    The point here isn't that he was wrong. In fact in some cases he was accurate (DIS +13% is pretty spot on), the issue is the same one that most pundits face; they have a hard time separating what happened recently from what they expect to happen moving forward. A classic example of this from the mouth of Jim Cramer came just six days into the new year where he suggested that oil, which had been halved in a short period of time may have bottomed. 

    It's incredibly important to remember that many fund managers are Beta traders. A Beta trader is someone who by definition does well when the market does well and does poorly when the market doesn't do as well. As you've noticed this year has been tough for many of the most popular and notable fund managers out there. Guys like Ackman, Einhorn, Icahn and many others have struggled and are underperforming the markets. 


    BREATHE OUT

    2015 WAS THE YEAR OF THE ANTICIPATED "BUBBLE" POP

    2015 WAS THE YEAR OF THE ANTICIPATED "BUBBLE" POP


    YOU'RE going to hear a lot of predictions in the next few days and weeks. You're also going to hear a lot of bogus statistics. Correlations that make dude's sweating in suits look like what they know what they're talking about. One example of this is that is popular amongst the talking heads right now is that when high yield bond markets fall during a given year, 80% of the time the markets are up (significantly) the following year. This will be the bull thesis moving forward for many of these "pundits" that require having an audience to actually maintain an income (They more than likely couldn't survive on their trading alone). So this reactionary tailwind will continue until it doesn't, and when it doesn't that's when it's your time to get in.

    ⚡️☝⚡️☝What does this mean? ☝⚡️☝⚡️

    In November of 2014, I told @slavavancouver my bias that the oil markets are going to implode in the next year as Saudi Arabia floods the markets with oil to destroy the fracking companies and competition. I outlined for her, and others, my thesis that as more and more oil comes online and demand remains consistent oil will continue to fall precipitously as many oil companies are/were heavily leveraged with debt. 


    join now

    Get access to real time trades, analysis, and market insights in our live chat room


    I'm not trying to pound my chest here or give the whole "I told you so" bullshit. I am however absolutely certain that I did not hear that narrative from any major financial syndicate until fall 2015. So what I'm saying above is that you're going to hear a lot of reactionary nonsense about how people now know what the hell they're talking about with markets and with the fall of oil. You're going to hear a lot of differing opinions and a dialogue tug of war about the oil markets. Here's the reality.

    There are a lot of companies that have a lot of debt. I'm talking a mountain of fucking debt. These same companies are going to get obliterated. The big ones are going to take on more debt to keep operations going business as usual for shareholders and so they can offer pennies on the dollar to buy out the smaller destroyed companies and claim their assets. A fucking land-grab of assets. One problem -- everyone's ready to call a bottom. That makes me believe that we're going a lot lower in oil. The bias is that $20 oil is low and we "can" reach that. Well what if we blow through that? What happens then? What happens for the huge companies that think they can keep it together? I'm not predicting that we do get there, but I've been doing this for 10 years now and markets rarely give investors time to get out, or get in. This is a disaster extreme case scenario and though I'm not calling for it. But I'm also not ruling it out. Ignore the guys and girls too smart for their own good on TV. Don't attempt to find a bottom. CASH IS A POSITION.


    UNDER THE HOOD


    THERE is no reason why the current bias (lower) should change at all. Hope is not a merit by which traders can profit consistently. That said, sit on your ass, ignore the bullish rhetoric and wait. Be selective, be skeptical, and be patient. The markets rarely give individuals an opportunity to get in or out. We've been hanging around 2100 for a very long time now, the bias is if we were going to breakout, we would have done so. With market breadth weakening "under the hood," it's only a matter of time before investors start to sell the winners (NFLX AMZN GOOGL PCLN FB). It's also unlikely that this "dash for trash" continues into the new year as there is no catalyst currently to help the dip buyers that existed at the end of 2015. 

    SPX Rounded top with a downtrend on a lower high


    TROUBLE IN PARADISE


    There is no reason to step in and try to pick where the bull vs bear fight will end

    There is no reason to step in and try to pick where the bull vs bear fight will end

    I like to use relationships as a metaphor when explaining the stock market to those who don't know much about it. In this case, the market provides a very good metaphor. The more you hear someone attempt to convince you (and themselves) that their relationship is in good standing, the less likely that is the case. The more a couple has to have talks about how to make things work, the less likely things will actually work. Keep that in mind when you hear pundit after pundit give you bogus stat after bogus stat on why the market should go higher in 2016. 

    I am not advocating that a year from now we won't be higher, I am simply advocating that there is currently no reason for us to go higher. I am an advocate of waiting for a flush of some kind and a floor before looking to get aggressively long. 

    My sentiment in 2016 is simple. Oil is fucked until it's not, stocks are struggling to find leadership, breadth is weak under the hood, bifurcation will only get worse, pundits will stay behind the curve, cash is still a position, leaders will lead both upwards and then back down, and finally no need to be a hero. As always, do your own homework and ignore the noise you see on the tube. Their performance is not much better than the average joe.


    As always if you liked this post please click the 💜and/or share. 

    Stick to the Plan

    1 Comment

    Stick to the Plan

    Start at Stop: Form a Plan

    The only thing to do when a person is wrong is to be right, by ceasing to be wrong. Cut your losses quickly, without hesitation. Don’t waste time. When a stock moves below a mental-stop, sell it immediately.
    — Jesse Livermore

    You're probably here because you want to make money in the stock market. You might be someone who is new to trading, someone who's been trading for a while and wants to get better, someone who thinks the market is rigged, someone who is bored and doesn't want to trade on their own, someone who is at their wits end with the market etc etc. Whatever the reason is that brought you here today, if there is one thing that you take away from this site please let it be this -- Form a plan and stick to it.

    Let's run an experiment. Close your eyes and think of the last person you spoke to about the stock market that isn't an active trader/investor. What was the first thing they asked when you told that person about the market or a trade you took? Almost all of you probably thought "How much can I make?" That comment is so unbelievably common it almost always makes me chuckle. That comment is why I wanted to start here, at the very beginning. 

    Most people who fail when it comes to investing/trading do so because they lack focus and conviction in their plan. Whether it's not knowing your setup, not trusting your setup, or just plain old greed, lacking a plan or not sticking to one will almost always ruin you as a trader/investor. Having a plan is so important that I felt it must be addressed at the very top. Having a plan is the fundamental backbone to investing/trading. It is something that anyone can do, even if they have no stock market experience. 

    You might be asking yourself "How do I form a plan if I don't know anything about the stock market?" Ah, that's simple, by using a stop loss.

    • Stop Loss:  In simple terms, a stop loss is your emergency exit strategy. It's the absolute maximum you are willing to lose on a trade/investment that you place. 

    The most common mistake I see from new and seasoned investors alike is not respecting their stops, or worse, not having one. Even more troubling, and like the experiment we ran at the top, many who are new to investing (or worse some who have been doing it for years) think in terms of what their profit will be prior to entering a trade, rather than what they could possibly lose. This is a fool's mindset. The key to investment/trading is capital preservation. You simply cannot preserve your capital if you do not know what you can possibly lose. 

    So if you take nothing away from this post, or any other post in the future, please take the following away; Always know what you are willing to lose before you enter a trade. Always know your breaking point. 

    That simple rebalance of your thought process will set you apart from most investors/traders and put you on the path to success. 


    1 Comment

    Holy Burrito

    Comment

    Holy Burrito

    Patience is the key to success not speed. Time is a cunning speculator’s best friend if he uses it right.
    — Jesse Livermore

    The market will make a fool out of anyone. Even when you are right, there will come a time where your patience is tested and you will subsequently question yourself. With the rush of bad news in Chipotle a few weeks ago you would have believed that the stock would be left for dead. The market was poised to make a mark out of anyone however and test the resolve of anyone who was waiting for damning news (myself included).  

    A little over a week ago I wrote about closing half of my $CMG positions. Not because I did not believe in all of the bearishness, but rather because the stock was not behaving how I would like. I also highlighted that we would wait for our cue to re-enter puts in the stock and play it for some more downside. A few days later we got our catalyst. 

    Jim Cramer had the Chipotle management on his show late last week. In the interview the CMG CEO told Cramer and his audience that the E.Coli scare has been contained and that it essentially would not trouble the company moving forward. The stock however, told a different story. The next day CMG gapped up into previous resistance and battled into the 10day yet again. From there, the stock sold off and continued to do so for three days. On that failure, I added to my existing position and used the high set as my stop. 

    CMG failed trend

    With a little bit of luck, a lot of patience, and even more homework the trade did not present a failure or retest of trend of any kind. With the market's poor reaction to Aunt Yellen and her crew's rate hike decision the stock continued to prove a good one. 

    In Reminiscences of a Stock Operator the lead character Larry Livingston (Jesse Livermore's character) speaks on many occasion of being in a trade and watching the stock operators manipulate the stock. He comments on how he's been in the right trade and watched his paper profits all but evaporate. This is the scenario I found myself in prior to being given the opportunity to add to the position. There comes many times as a stock trader where your resolve will be tested. This scenario proved no exception. And with the price action staying consistent but the swings growing wild I would be lying if I told you I didn't question the trade. That said, the stock failed the highlighted level (again) and sure enough the weak tape was correct again as more E.Coli news circulated. 

    As important as it is to hold true to the setup it is equally important to take your profits when you are handed them. Without expecting any sort of news like this I/we would be foolish not to capitalize on this gift. With that said and with IV shooting through the roof I was able to clear off my books more than 40% of the position for stellar profits. The cost of the trade and then some was removed and I will continue monitoring the issue closely. 

    Here's a timestamped notice of the position and how it eventually turned out. 

    CMG position highlighted this morning.

    CMG position highlighted this morning.


    Get real time alerts

    Sign up for real time alerts, real time market insights, and real time actionable insights.


    For the sake of keeping tabs, lets take a look at some important levels CMG will face moving forward.

    CMG Weekly


    DERIVATIVE


    With a dwindling consumer base many of these customers will have to go elsewhere. People still have to eat, you know? That said, it is plausible that CMG competitors Moe's and Q'doba see an uptick in traffic YoY. It's also very likely that other fast casual dining options start to get more volume. So with that said, let's take a look at both JACK and PNRA: 

    JACK Rangebound

    PNRA Constructive

    Between the two charts, it appears that JACK provides the cleanest setup to the upside as the issue has been rangebound for several months now. PNRA also sets up nicely above 200/share.

    We will keep an eye on the issues moving forward and look for a continuation. As always if any of this has been helpful please comment/like/share. 


    Comment

    Juice Cleanse

    1 Comment

    Juice Cleanse

    The fruits of your success will be in direct ratio to the honesty and sincerity of your own effort in keeping your own records, doing your own thinking, and reaching your own conclusions.
    — Jesse Livermore

    If the Wall St. narrative runs its course, something definitely has to give with AAPL. The issue, which has traded poorly since making an all time continues to do so. If you have not yet, you should start to consider what your threshold tolerance for pain should be.

    What was once a market leader, AAPL has certainly underperformed its peers this year. With stocks like AMZN NFLX and GOOGL all up substantially YTD it is only fair to wonder what is happening with AAPL (the stock, not the company). Before I dive in a little deeper I want to stress that I am a big fan of the company and believe that they are the most soundly run company that I've ever encountered. I liken Apple as the A student in the class. Eventually, the teacher gets accustomed to that student's stellar results and starts to only make commentary on his/her "poor" (A-) performance. The opposite is also true. There will always be students that are B/C students and when they start to perform up to the B/A level the teacher will be impressed more so than when the A student continues to make his/her marks. Let's focus on this first.

    As humans, we're psychologically wired a certain way. Specifically, we like to believe that we are the purveyors of information and that we actually know more than our peers. Ironically however, it takes those same peers for us to get anywhere typically. That's why shit stocks like TWTR continue to find fools as they continue their landslide lower. In order for a market to be made, you need liquidity. In order for liquidity to exist, you need people on opposite sides.

    It is very important to distinguish between Apple the company, and AAPL the stock. As I said above, the company is likely the best one we've ever seen and will ever see in our lifetime. Currently however, the stock is not. As highlighted a multiple times and most recently a week ago, the stock is currently and has been trading poorly. It does not matter what time frame you use on a chart, it is tough to find viable support in the issue. That said, that's not the biggest problem the stock may face. I use the word may because this company has been founded on innovation and can turn the corner at any point and regain their innovative ways. We can all speculate what we believe is in their pipeline, or what cutting a particular supplier may do, but at the end of the day we simply do not know. 


    GETTING "OVER"


    Aside from poor performance and relative weakness to its peers, AAPL has another hurdle it may have to overcome. Up until now, the stock is still endeared in the eyes of Wall St. analysts. With 47 Buy ratings, 7 Holds, and 1 Sell, the stock is still heralded. Though this works in the favor of the company currently, it may end up "taking a bite" out of the stock in the future (if things precipitate to the downside).

    Let me put that statement in basic terms for you. Currently, basically everyone and their fucking brother is positive on AAPL, and the stock still can't seem to perform. What happens when people who have been bullish all of a sudden get tired of the bull case and switch their tune? If the stock is not performing by then, it will likely start to really crumble. 


    Click the "Join Now" button below to sign up for private content and real time actionable alerts.


    Another past positive and potential clusterfuck for them is the ownership stake by Carl Icahn. Upon announcement of the stock purchase, the stock rallied, and rallied hard to eventual all time highs. Icahn indicated that this purchase was again a "no brainer" like his NFLX transaction. Though this may be the case, the stock's performance has not been that way. So it will be interesting to see where he goes with this trade moving forward given quickly rising poor market sentiment. 


    THE SKINNY


    At this point many speculate that part of the problem with how AAPL has been behaving/performing is in part due to their potential that this will in fact be the first holiday quarter in which the company does not see iPhone sales increases. Put another way, this will be the first time (allegedly) where the company sees a slowdown in iPhone sales year over year (COMPS). 

    That said, the stock is still cheap. Trading at <10x EPS. At this point it really depends on what type of investor/trader you are. If you are of the speculative variety and look for quick hitters, this is probably not the stock for you. If you are looking for value and for potential long term growth, this could soon provide you with the "no brainer" opportunity many see/saw in the stock. In my eyes, the stock is currently a "no touch" until it proves the 105/103 support zones are for real or clears 122. 

    As always, if you found any of this useful please share. Cheers!


    JOIN NOW

    For real time actionable trade alerts and private site content.


    1 Comment

    Adapt or Die

    Comment

    Adapt or Die

    Markets are never wrong. Opinions are often.
    — Jesse Livermore

    If you are honest with yourself, like really really honest, you will know that often have to throw your opinions out the window when it comes to trading. The most successful of traders aren't those with the best trades necessarily, but rather those that have the ability to adapt most quickly. The markets are simply Darwinism at its finest. Eat or be eaten. Adapt or die. 

    Whether you're talking about companies that fail and eventually go out of business (Radio Shak) or trades that take too long to materialize the markets are inevitably the same in nature. It is a zero sum game and binary in nature. For every winner there's at least one loser. If you remember this and learn to execute setups that are positioned for your optimal success you will likely not suffer. That said, it's very simple for me or anyone else for that matter to point out a list of cliches that mean nothing and make us sound like we know what the fuck we're talking about. It's something completely different to put those actions into actionable items. 

    One of the many reasons traders often fail is their inability to adapt to changing market conditions and their stubborn reliance on hope. It is important to know your limitations as a trader and to adapt and learn when it's okay to press your luck and when it is good to walk away. 

    I will attempt to stress this example with a recent trade we made on CMG. 


    BURRITO


    I first highlighted CMG to subscribers on November 20th as a long shot short. We highlighted the short when the stock first broke support on news of spreading E.coli concerns. We focused on the following week's out of the money 530 puts and those who took the trade were paid handsomely. 

    A couple of days later, we entered short on CMG again. The thesis was CMG would struggle to get over the ten day moving average. Again the thesis was correct, yet the stock did not move as we'd hoped/expected initially. As Friday rolled around we re-entered the short position in CMG, this time again targeting the following week's 530 puts. Once again, E.coli news struck and the stock was crushed on Friday. Our puts traded from 2.6 to 12+ on that Friday and we were able to offload our risk for a profit. We then took some of the profits and rolled down into lower strike puts to keep the trade on. That evening after market close, we were blessed yet again as Chipotle cut its guidance. As Monday morning rolled around, the stock opened significantly lower and our puts paid once again. Pre-market I highlighted to subscribers not to chase the trade short as it traded into 497 support int he pre-market that morning. 

    CMG Highlighted with levels on December 2nd

    Since then, the stock has been a little wonky. We've tried to short it again into the ten day except this time it did not cooperate. This is a very frustrating incident and is the important topic that I am focusing on in this post. 


    SOMETIMES IT JUST DOESN'T WORK


    As I stated above, to be a good trader you have to learn to adapt. Last week CMG had the perfect storm of events that should have obliterated the stock. On Monday the stock opened at 515 after the company cut its guidance on Friday after the close. In the pre-market the stock touched our highlighted support from December 2nd (497). Subscribers were alerted to cover their short and wait for the setup again. 

    I want to fast forward to Wednesday where our thesis was that CMG had been failing against 560. We entered Jan 530 puts against that 560 range and held the puts overnight. When we took the trade, the thesis was that CMG was trading into ten day MA resistance and into an hourly downtrend. We also highlighted 584 as an extreme case upside resistance. 

    CMG 1 Hour Trend Line

    The next day we (unfortunately) woke up to a press junket by CMG's CEO along with other sympathy news and rallied. We were met with our upside resistance target of 584 quickly and subsequently added to our trade against the 580 price point. 


    SO WHAT HAPPENED?


    On Thursday afternoon various reports online indicated that a store in Seattle was closed that day for health violations. This closure came after the CEO's apology and news of more illnesses spread. The stock futures also pointed to a much lower open in the overall market. Our thesis was proving true yet again, especially with the sea of red in the stock futures. That morning I alerted subscribers that the odds were in our favor for this stock to be taken out to the woodshed. That said, I highlighted many different scenarios and time frames and presented them with various charts for possibilities of what to look for. 

    To my/our dismay, CMG's stock opened down just marginally after the health closure, other bad news, a downgrade, and an overall obliterated stock market. After about two hours of babysitting the stock I alerted that I will be taking a loss on a bulk of my position and will not keep the risk on the table. 

    Though CMG was still below our final stop out point, I believed that the market was telling us something. There was every reason for this stock to crumble yet again and it was seemingly behaving strong (relatively) in a weak tape. Rather than allow an opportunity for more upside pain, I felt that it was prudent to take the risk off and address that risk elsewhere. With every reason for the stock to be down another 30 points, it wasn't. It held up nicely and seemed to be unaffected by the SPX's dismantling. 

    The point here is that sometimes the market gives you every reason for your trade thesis to pan out the way you want it to. If it doesn't it is important to (re)evaluate your positions/thesis. It is okay to adapt to current market conditions and know your threshold for pain. Being diligent, cautious, and prudent is not a bad thing when it comes to your adaption of risk. When your thesis does not pan out appropriately in the timeframe that you are setting, it is very important for you to adapt with what the market is presenting you. The key to solvency in any market is preservation of capital. Again, the most important aspect and the key to solvency in any market is capital preservation. As a trader it is important to remember this as capital is more than just cash, it is opportunity. I always try to remind traders (and myself) that taking a loss is not a bad thing, losing your money because you did not take a loss is. As with other trades, I will continue to watch CMG and wait for it to set back up so I/we may re-enter again.

    Copy of CMG Failed Inspection

    CMG Still in Weekly Downtrend


    To receive real time actionable alerts and access to our private content sign up here!

    AS ALWAYS THE INFORMATION PRESENTED HERE IS ONLY OPINIONS AND IT IS NOT INTENDED FOR THE PURPOSES OF ADVICE. FOR FINANCIAL ADVISE PLEASE CONTACT YOUR FINANCIAL ADVISOR/PROFESSIONAL.

    Comment

    Threading the Needle

    Comment

    Threading the Needle

    It is not good to be too curious about all the reasons behind price movements.
    — Jesse Livermore

    Like many, I spent a part of my weekend keeping tabs on what was going on in Paris. I tried my best to avoid 3rd part media outlets and tried to stick to raw data from a Reddit thread a friend of mine passed on to me. Going into Friday my bias was to the downside and with relentless selling pressure and support broken on Friday in SPX I saw no reason for that downside pressure to cease. 

    So with the news of a terror attack shortly after the market closed on Friday it was no surprise that stock futures accelerated their declines. And when they closed for the remainder of the weekend at 8pm on Friday, the markets were hinged on just how bad the news would be from Paris. Two days of pins and needles. When they finally reopened Sunday night those wanted to panic did. And with that sudden and slight panic we tested the 2000 support level on SPX and found support there. Monday's session followed this lead and the markets continued in uptrend fashion "business as usual." 

    Personally, I am not a fan of trying to find trades that require precise entries. I prefer broader time frame breakouts/breakdowns and find painting with a broader brush to provide the optimal risk reward for success. Monday's tape however provided great opportunity for "bottom fishing." Specifically with AMZN. 

    AMZN's stock just came off nearly a 10% decline from its all time high just this past Thursday. The issue was trading off nearly 53 points in just 1.5 sessions. This decline landed the stock near some critical support and gave us an entry opportunity. Again, I am typically the type of trader that finds broad based breakouts and breakdowns on multiple time frames, but could not resist an opportunity like this. I want to quickly assess the psychology of the trade and give a frame of reference to it for future potential finds like it. 

    AMZN 4 H.png

    If we take a look at both the daily and weekly charts for AMZN we notice that there is support near the 620 level on the issue. Furthermore, if we take a look at the 4 hour chart we see a solid trend line in tact and both support and 50 day support lined up again near 620. With this information, I assessed how the stock would behave on a five minute basis (MOMO) intraday chart. 

    AMZN 5 Min.png

    As we can clearly see on the five minute chart, the issue found its support around 620 as we'd hoped. Specifically we saw three hammers on the five minute followed by higher lows and higher highs. Though our exact target of 620 was not necessarily tagged, that level was in fact tested and did in fact hold. That presented us with a beautiful combination of an opportunity. 

    The following combination is what I'd like to highlight:

    -Approximate 10% retrace from ATH in just two sessions 

    -Wildly "oversold" conditions both in the market itself and in the issue

    -Multiple time frame support alignment

    -Multiple hammers against multiple support levels. 

    With that said, each one of these indicators alone would present for a good opportunity to the long side. Combined they presented a great combination for a very well defined trade. Moving forward, we are now able to see what sort of potential a trade like this may have. 


    Comment

    Don't Stop

    Comment

    Don't Stop

    A bull market is like sex. It feels best just before it ends.
    — Warren Buffett

    Do you remember that insanely hot girl (or guy) you dated that really knew how to "Knock your socks off"? You know, the wild one that could never get enough but drove you fucking nuts in the process. Your friends (correctly) thought (s)he was batshit crazy and you always fought, but the sex was good. Damn the sex was fucking good.

    When you weren't tearing each other's clothes off, you were close to tearing each others heads off. The highs were insanely high, and the lows were salt of the earth low. That's kind of like what the stock market is like right now. Just two weeks ago, we were on the verge of staring into an abyss. Today, we are all orgasmic. 


    KEEP COOL


    That girl we just mentioned (or guy), do you remember how you got them? It just sort of happened right? You likely fucked up along the way but didn't overdo it and didn't overstep your bounds. When it "mattered" you performed and things worked from there. You never got too high and you never got too low. You took it for what it was and had fun with that person. 

    I bring this up because it seems like that is where the stock market is right now. She's a hot and cold crazy psycho bitch. But she's fucking hot and when things are great, she's fucking great. 

    I want to emphasize to you right now that this hot crazy bitch is not someone you are going to marry or take home to mom and dad. Get that through your thick skull right now and you can continue to have the time of your life with her and have the highs of your life. If you don't understand this, you're going to lose you shit, get needy and indecisive, and get left on the corner disillusioned and lonelier than the last man standing. 


    FLAVOR OF THE WEEK


    The thing about crazy hot chicks is that they're always on to the next bit of drama they can seek. This week it's Tom with a motorcycle and a record, next it's Kyle the pro athlete, and the following its Dwayne the hedge fund guy flying her to Dubai for the week. Her entire life at this point is one high to the next and she needs to keep revolving that door to keep it going. A quiet Saturday watching movies ain't gonna cut it with this chick, you gotta keep her entertained. 

    If we know that the market is a crazy hot chick, and we know that crazy hot chicks need to stay entertained, we should be able to understand what is going on in the market at this point in time. 

    Right now, she (the market) is courting suitor after suitor. She's the gem of the ball and everyone wants a dance, but she has her pick. 


    THE BIG BOYS


    A few weeks ago, she was into the younger guys who no one believed in. The ones that knew of the underground parties and had records. She believed in them. They were fun and
    got her" like no one else. That was thrilling and all, but she likes nice things and the weekends at the Hamptons are fun. 

    What do I mean by this? Go through your list and get rid of (for now) all the small cap garbage that hasn't moved out of a range for weeks. The TWTR's of the world, dump 'em. If we take a look at the IWM as of late, we see this confirmed. 

    IWM Slowing

    In the above chart you'll see that the IWM, which at one point was basically the leader of the bull market, has stagnated and is not really moving much. We can speculate all we want about why that is but let's not. Let's just focus on the reality; it's slowing.

    So if it's still the leader that means that the other indices should follow its lead. Let's see if that's the case. 

    When we look at the three major indices, the Nasdaq, S&P, and the Dow we notice that they are not following the lead of the IWM anymore. They have separated and have started to do their own thing. Of the three, the Nasdaq is clearly the one that was least impacted and appears to be the strongest, followed by the Dow, and then obviously the S&P.

    If we take a look at some of the components of these indices we can really hone in on the hot chicks love interests. 

    Remember, our chick is super hot and crazy and she only likes the rich ones right now.


    DJIA


    The DJIA components are the largest components of the market. The blue chips. These are the stocks that the big funds around the world mostly dabble in. We're gonna take a look at the most recent sexiest stocks in this index.

    The above charts serve proof that once the flash crash on August 24th resolved itself, these big name stocks have slowly and consistently gone higher and higher. Our favorites of the bunch are MSFT HD NKE and V (in no particular order).


    NASDAQ


    Usually the most volatile and moonshot of the bunch, the Nasdaq has actually been quite tame relative to the other indexes. It has fallen the least of the bunch, but it also has not exploded to the upside like you'd anticipate. This is because the IBB and its components which were our leaders in the past are now dumped by our hot girl while she seeks new suitors. 

    Comment

    Red Handed Denial

    Comment

    Red Handed Denial

    We want to perceive ourselves as winners, but successful traders are always focusing on their losses.
    — Peter Borish

    I want to start by saying that even with today's nonsense I walked away from the table with a significantly profitable day. Not Wall Street billionaire or Oprah Winfrey Weight Watchers big, but big nonetheless. 

    I have been a trader in some capacity, whether amateur or professional, for over nine years now. In my time I've survived some crazy upswings and some violent turmoil. I've seen companies implode and others sustain astronomical gains. I've watched as CNBC has recycled and churned their fair share of pundits and "hot shots." Like all "viewers" I have my fair share of likes and dislikes, I've ridden the wave of "Fuck you Uncle Carl" to "Holy shit, uncle Carl!", and have watched the totem pole of the "Hot new hedge fund king" get churned. 

    With all that said, I've never seen anyone cross the airwaves (including Dan Nathan himself) in such privileged pejorative guile anywhere close to that of William "Bill" Ackman. Aside from his self absorbed attitude where even his billionaire peers hate his guts, I cannot recollect an instance in the last three years plus where that guy has been significantly right on anything. When I pour through his bio, I can't see anything really that screams "Brilliant" when it comes to trading or investing. I guess the MBIA thing maybe, yeah, maybe? 10% stake in Target? Well I guess if you have that kind of cash, yeah sure. The Barnes & Noble deal? Lol, really? That's all you got?

    Before I go any further I want to take a moment and show a two graphs. I also want to remind everyone that no one individual is bigger than the tape. No matter what sort of self righteous  Napoleon complex exists with them, they are just minnow in an ocean of whales. 

    Bubble Phases

    Bubble Phases

    These are the well known, repeated, and outlined phases of any stock market bubble and crash. 


    VRX


    VRX Weekly

    If you lay VRX over the phases of a bubble what do you get?

    Fucking perfection. 


    Dear Bill, you privileged narcissistic asshole, you are fucking wrong. Admit it, move on.

    The fun thing about the market is that even when you are right, but not right with the timing, you will go broke before you are actually right. I get it, you grew up in a privileged New York Real Estate family and are accustomed to hanging around people that were not on your level. But Billy, this is like the time where you bet your dad you'll get an 800 on your SAT. Except this time, your dad can't let you off the hook and you're fucking with other people's money. Not just your own. This isn't

    Oh and Billy, take it from a guy who actually got a perfect test score and is used to being "The smartest guy in the room" (even with you in it). Doubling down on monopoly money at the tail end of a QE cycle is just lunacy. Especially when shit is broken. You might as well head to vegas "Playar." 

    Based on nothing more than your arrogance I hope to God you're wrong and this VRX is Enron 2.0. Just so I can stop hearing about you and your self adoration. 

    Aside from all this, I am just unsure how long this will last before people start to investigate if you're running a Ponzi Scheme the likes of which has not been seen since Bernie. Seriously, how is anyone as wrong as often as you are without any severe setbacks? Tick tock Billy, tick tock. 

    Currently NO POSITION in VRX.


    Comment

    Stay Golden

    1 Comment

    Stay Golden

    Everything you need to know is right there in front of you.
    — Jesse Livermore

    This morning was weird. The market felt heavy and tired. The bulls seemed exhausted and it appeared as though we'd get a late day fade such as the one we had yesterday. Earnings were missing left and right, market leaders were weighing on the market, everything "felt sluggish." I mean, even I called it this morning premarket. "$GS 175-176 support if it closes below that get ready to short it to hell."

    Something strange happened this morning though, something different. This was the first time in a while that the market Bulls seemed to sucker the Bears in. As the SPY was fading later morning and our members were saying "Get ready for a fade!" the market internals were telling you something different. Stock heavyweights were not giving up support. AMZN wouldn't relinquish its grip on 547, GS moonshot off the lows, hell, even WMT caught a bid off its 3 year lows. Something was different, and I was letting everyone know "Don't expect the fade at the end of the day." 

    With the potential for a lack of tightening and possibility of another round of some form of easing, today's tape basically told the bears "Fuck you." The bulls which have been waiting for months for the floor to fall out underneath them decided to take a stand. They decided, for whatever reason, that today would be the day they put the onus on the bears and dare them to move. If you're a bear, this isn't good news. 

    This is the part of the year where things really start to ramp seasonally. I don't know if it's the cold air, the PSL mania, or all the scarecrows but something about the middle of October on usually gets things going. So with that said, we turned from Heel to Face and sometime around 12pm we went very very long. 


    GO WITH THE FLOW


    I have news for you, the market is in fact rigged. There is no doubt about it, the big boys are in control of it and there is nothing you can do about it. That said, we have advantages that the big boys never have. We have the ability to switch our opinions on a dime and follow the money. Today was a classic example of that. Staying stubborn and not following the trend will blow you out of the water. But days like today are great for us as well because we can participate and stay in the action without risking much capital upfront. We're gonna take a look at some examples of this. 


    GS & FINANCIALS


    This morning I highlighted GS support at 175 for members. We highlighted bias to the downside after an earnings miss and kept it on our radar. GS however decided to change the rhetoric and flipped a long off that 175. That flip along with commentary about growing organic loans from other banks sparked a fire in the space. You could have bought calls very cheaply today and walked away very very pleased if you were paying attention. This is just one example of how simply only knowing the support of a stock could help you capitalize even if your bias was initially incorrect. 

    GS JPM and XLF 


    IBB & BIOTECH


    In the premarket the IBB looked like it was going to be the leader to the downside. With a subpoena issued to VRX, a heavy market, and with the IBB at support premarket this one appeared as though it was left for dead. Yet again however, buyers stepped in at support. Claiming 298 and riding it higher throughout the day, buyers continued and reclaimed the bear flag breakdown from the other day. 

    Bios up up and away.


    F.N.G. AMZN


    With NFLX missing ER last night you would think that the other betas would have been hit as well. That however wasn't the case as the beta cohorts really ramped, especially AMZN. 

    AMZN gapped higher with the market and appeared it was going to repeat what it went through yesterday where it lagged its internet peers. However, this time AMZN held support at 547 and started its catch up trade higher. 

    On the heels of poor #'s from NFLX and a bad revision from WMT buyers stepped in ahead of next weeks report and bid the stock to highs not seen since its last ER and its highest closing high ever. 

    Buying was relentless and lasted throughout the day. Expect this issue to resolve even higher before the company announces next week. 

    AMZN played "catch up" with its cohorts as it lagged the last couple of days. 


    SPY & QQQ


    This face tearing rally sets us up for an interesting fourth quarter and moving forward. Specifically, the SPX/SPY closed on the highs of the week and appear to have taken out important resistance and setting up for a test of even higher resist. 

    The same can be said about about the triple Q's which have been the strength of the three indices. Let's take a look at the next levels we may test. 

    SPY & QQQ Verge of breakout and potential levels. 

    With the SPY closing above the 202.2 level that was a brick wall of resistance earlier in the week we are primed to test the next levels of support. Barring a cataclysmic fall tomorrow morning look for this market to test the higher highs soon. Remember, we have the flexibility to switch our opinions and positions more often than the big boys. Because of this ability, we can, and should make money going up and going down. 

    CURRENT BIAS: LONG WITH POTENTIAL FOR HIGHER HIGHS

    1 Comment