Viewing entries in
Earnings

Building A Winner ($SANM Earnings)

Building A Winner ($SANM Earnings)

Sanmina (SANM) consensus stands at EPS of $0.56 on Revenues of $1.59 bln.

SANM is coming off a solid Q1 report. Its EPS were in line and its revenues actually missed expectations, but the revenue miss was expected. However, SANM operating margin was higher than expected and its Q2 guidance was also above consensus. The stock jumped 8% in reaction and has been a steady performer since as it would rally through a slew of key moving averages to push to $23.50.


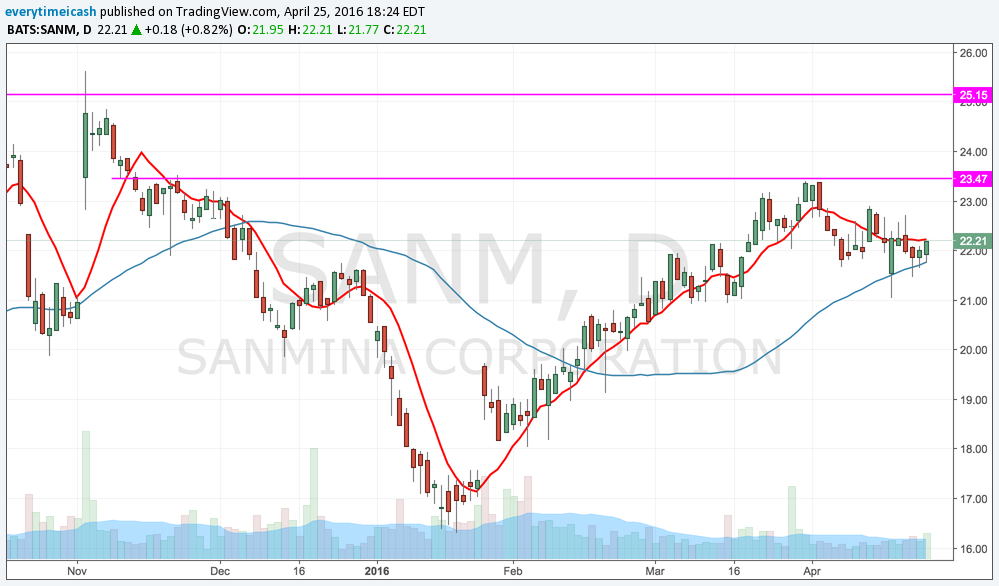
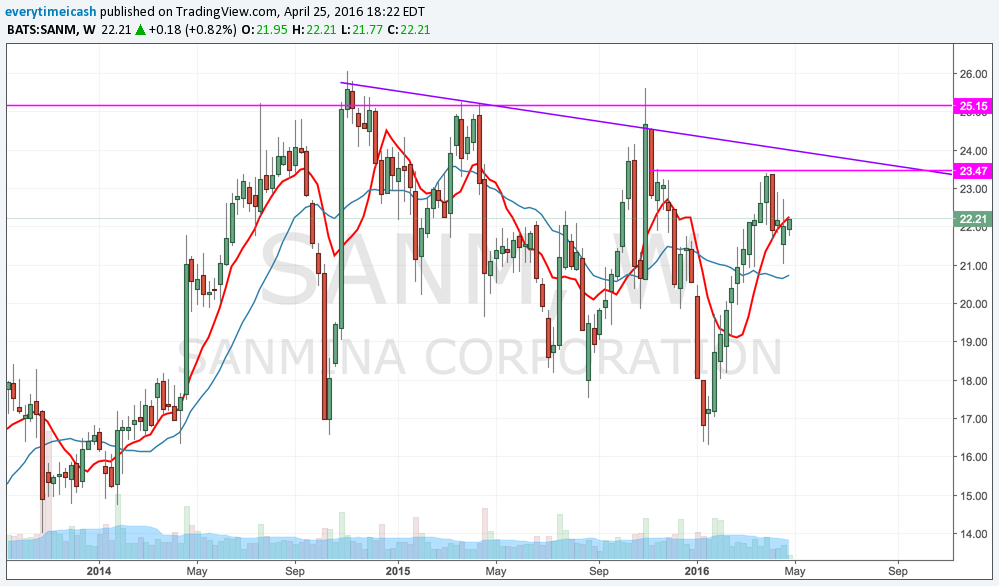
Shares were ~30% higher from when it reported Q1 results. The stock has retraced back to its 50MA ahead of tonight's report. The decline is most likely some profit taking after a strong run during the quarter. The stock is sitting on its 50MA ($21.80) and has key support in the $21 zone.


Key Metrics

  • Non-GAAP Operating Margin- Q1 came in at 4.0% which was 10 bps higher than expected. Investors would like to see this continue to rise.
  • Share Repurchase- A tailwind for the Q1 results and it is expected to be a driver for Q2. SANM repurchased 1.4 mln shares for a total of $28.7 mln in Q1.

Q2 Guidance

  • SANM said it expects revenue to be in the range of $1.55-1.65 bln.
  • EPS is expected to be in the range of $0.55-0.59.

Q1 Recap

SANM reported Q1 (Dec) earnings of $0.58 per share, excluding non-recurring items, in-line with the Consensus of $0.58. Revenues fell 9.9% year/year to $1.53 bln vs the $1.59 bln Capital IQ Consensus.

  • Ending cash and cash equivalents were $398.4 million
  • Cash flow from operations was 62.7 million
  • Repurchased 1.4 million common shares for $28.7 million
  • Inventory turns were 6.2x Cash cycle days were 47.2 days.
  • Co issued Q2 EPS guidance in the range of $0.55-0.59, excluding non-recurring items, vs. then-$0.52 Consensus Estimates. Co projected Q2 revenues in the range of $1.55-1.65 bln vs. then-$1.57 bln Capital IQ Consensus Estimate.

RESULTS

Sanmina beats by $0.07, beats on revs; guides Q3 EPS in-line, revs in-line  

  • Reports Q2 (Mar) earnings of $0.63 per share, excluding non-recurring items, $0.07 better than the Consensus of $0.56; revenues increased 1% year/year to $1.61 bln vs the $1.59 bln Consensus. 
    • Non-GAAP Operating Margin 4.10% compared to 4.00% in Q4.
    • Repurchased 4.0 million common shares for $74.7 million
    • Inventory turns were 6.5x
    • Cash cycle days were 44.6 days
  • Co issues in-line guidance for Q3, sees EPS of $0.61-0.65 vs. $0.61 Capital IQ Consensus Estimate; sees Q3 revs of $1.625-1.675 bln vs. $1.64 bln Capital IQ Consensus Estimate.

$GOOGL Me BRUH

$GOOGL Me BRUH

Alphabet (GOOG, GOOGL) is set to report Q1 results tonight after the close with a conference call to follow at 4:30pm ET. GOOG reported Q4 results at 4:01pm.

Current consensus is looking for EPS of $7.96 on Revenue of $20.38 bln.

KEY METRICS:


  • Revenue Growth- Q4 saw 18% which was a marked improvement from the prior three quarters (13.0%, 11.1%, 11.9%); Expectations are for another 18% y/y increase.
  • Non-GAAP Operating Margin- Increased to 32% in Q4. Google's Core margins were up 320 bps to 47%.
  • Aggregate paid Clicks- Q4 increased 22% q/q on Google websites.
  • Q4 Aggregate cost-per-click- Q4 was down 5% q/q in Q4.

Q4 Recap

GOOGL reported Q4 (Dec) earnings of $8.67 per share, $0.58 better than the Capital IQ Consensus of $8.09. Revenues rose 18.5% year/year to $21.33 bln vs the $20.76 bln Capital IQ Consensus.

Aggregate paid clicks- Q4 +31%; Q3 +23%.

  • Paid Clicks on Google websites- Q4 +40%; Q3 +35%.
  • Paid clicks on member sites- Q4 +2%; Q3 -5%.

Aggregate cost per click- Q4 -13%; Q3 -11%.

  • CPC on Google sites- Q4 -16%; Q3 -16%.
  • CPC on member sites- Q4 -8%; Q3 -4%.

Revenue Segments

  • Google Website revenue +20% y/y
  • Google Network Member websites +7% y/y
  • Google Advertising +17% y/y
  • Google Other Revenues +24% y/y
  • Operating Expense as % of revenue 36% compared to 37% in prior year
  • Free Cash Flow- $4.31 bln compared to $2.81 bln in prior year
  • TAC As a % of revenue- 21% compared to 22% in prior year.

Alphabet misses by $0.46, reports revs in-line

Reports Q1 (Mar) earnings of $7.50 per share, $0.46 worse than the Capital IQ Consensus of $7.96; revenues rose 17.4% year/year to $20.26 bln vs the $20.38 bln Capital IQ Consensus

Revenue Segments

  • Google Websites +20% y/y
  • Google Network Members' Websites 3%
  • Advertising Revenues +16% y/y
  • Google other revenues +24% y/y
  • Q1 Other Bets Revenue $166 mln; Operating Loss ($802) mln
  • Paid Clicks and Cost Per Clicks
    • Aggregate paid clicks- Q1 +29%;Q4 +31%; Q3 +23%.
      • Paid Clicks on Google websites- Q1 +38%; Q4 +40%; Q3 +35%.
      • Paid clicks on member sites- Q1 +2%; Q4 +2%; Q3 -5%.
    • Aggregate cost per click- Q1 -9%; Q4 -13%; Q3 -11%
      • CPC on Google sites- Q1 -12%; Q4 -16%; Q3 -16%.
  • CPC on member sites- Q1 -8%; Q4 -8%; Q3 -4%.
  • Q1 Free Cash Flow $5.23 bln
  • Q1 Effective Tax Rate 18%

It looks like expectations are growing as margins are contracting. This is not a good scenario for a growth company. The longer this goes the more likely the old google days are over.


Baking it In with Hal ($BHI $HAL Earnings Preview)

Baking it In with Hal ($BHI $HAL Earnings Preview)

Geographic Revenue Breakdown


  • North America -- 38.2% of total FY15 revenue
  • Latin America -- 11.4% of total FY15 revenue
  • Europe/Africa/Russia Caspian -- 20.8% of total FY15 revenue
  • Middle East/Asia Pacific -- 21.9% of total FY15 revenue
  • Industrial Services -- 7.7% of total FY15 revenue

Some of the most exciting news in this space in the past year was when Halliburton (HAL) announced an agreement which HAL will acquire all the outstanding shares of Baker Hughes (BHI) in a stock and cash transaction. 

In their last report, Halliburton said, "We are enthusiastic about and fully committed to closing the compelling BHI transaction, and remain confident we can achieve annual cost synergies of nearly $2 billion." BHI is the world's third largest oilfield services company. SLB is the largest and HAL is the second largest. 

Technicals

Technically, BHI remains in context of its downtrend off the 2015 highs, below its down-sloping 200-day moving averages (48/49). Energy as a whole has stabilized during Q1 of this year as Crude rallied back towards four month highs off the Feb lows.

BHI currenty sits along the top of its own 4-month range highs near the $47-area. A positive response to earnings will need to clear this resistance as well as the 200-day ma's above near 48/49. This would ignore more short covering. A negative response to earnings will liekly cause a test support near the 50-day ma's at 43/44, followed by its YTD range lows near 38/40.

HAL

Geographic Revenue Breakdown


  •  North America - 45.9% of total FY15 revenue
  • Latin America - 13.3% of total FY15 reveue
  • Europe/Africa -- 17.7% of total FY15 revenue
  • Middle East/Asia -- 23.1% of total FY15 revenue

In their annual report, Halliburton stated that the Baker Hughes acquisition may not be accretive, and may be dilutive, to their earnings per share in the near term.

A Technical Perspective

Technically, HAL has been on the mend off its January/February lows with a gain of more than 40%. It's recent upward momentum is clearing its longer-term downtrend line with price challenging resistance at the 40/41 area from the latter half of 2015. Expect price to push higher towards 45 on a positive response to earnings. A negative response will likely knock price back down towards the 36/37 followed by 34.

Options Activity

Based on HAL options, the current implied volatility stands at ~ 30%, which is 2% lower than historical volatility (over the past 30 days). Based on the HAL weekly Apr22 straddle, the options market is currently pricing in a move of ~2% in either direction by weekly expiration (Fri).

OIH WILL BE IMPACTED BY THE REPORTS

Sandy B $LVS Earnings

Sandy B $LVS Earnings

Las Vegas Sands misses by $0.18, misses on revs  

  • Reports Q1 (Mar) earnings of $0.45 per share, excluding non-recurring items, $0.18 worse than the Capital IQ Consensus of $0.63; revenues fell 9.8% year/year to $2.72 bln vs the $2.88 bln Capital IQ Consensus. EPS was $0.57 adjusted for Hold, or how lucky the casino was in terms of gambling win.
  • Hold-Normalized Adjusted Property EBITDA was $1.03 Billion - Consolidated Adjusted Property EBITDA was $917.6 Million
    • In Macao: Adjusted Property EBITDA was $510.4 Million - Strong Cost Discipline Drove a 190 Basis Point Improvement in Hold-Normalized Adjusted Property EBITDA Margin to 32.1%. "The operating environment in Macao remained challenging during the quarter; but we do see signs of stabilization, particularly in the mass market. Our focus on the higher margin mass and non-gaming segments and the geographic diversification of our cash flows enabled us to once again deliver in excess of one billion U.S. dollars of hold-normalized adjusted property EBITDA during the quarter... We remain confident that our market-leading Cotai Strip properties, which will be complemented later this year by The Parisian Macao, targeted to open in mid-September 2016, will continue to provide the economic benefits of diversification to Macao, help attract greater numbers of business and leisure travelers, and provide our company with an outstanding and diversified platform for growth in the years ahead."

WYNN Takes a hit after hours with the miss. 

Coke Head Happiness ($KO Earnings Preview)

Coke Head Happiness ($KO Earnings Preview)

Coca-Cola (KO) is scheduled to report Q1 earnings tomorrow, before the opening bell, at 6:55 ET.

Current Consensus is for Q1 EPS of $0.44 (-8% Y/Y) on revenues of $10.2 bln (-5% Y/Y).

  • Current Consensus is for FY 16 EPS $1.95 on revs of $42.3 bln

  • Last quarter, KO beat EPS by $0.01/share w/ revs in-line. 

FY 16 Guidance from Last Q

  • Organic revs expected to grow 4-5%
  • Expects currency neutral income before tax, structurally-adjusted to grow 6-8% in 2016
  • Expects net impact of acquisitions and divestitures to be a four-five point headwind to net revs
  • Expect ~$2-2.5 bln in net share repurchases in 2016
  • Expect comparable currency neutral EPS growth of 4-6%
  • Expect to spend $2.5-3 bln on capex
  • Due to structural changes, co anticipates slightly higher COGS and SG&A
  • Co expect the benefit to equity income from Monster, Coca-Cola Beverages Africa and Coca-Cola European Partners to partially offset that impact at operating income, resulting in a three to four point negative structural impact to income before tax.
  • Look for updates on the below two l/t initiatives
  • $3 bln in productivity savings
  • Additional Notables from Last Quarter
  • Unit case volume was +3% YoY for Q4, and +2% YoY for FY 15
  • Global price/mix grew 2% for quarter and FY 15

TECHS


The stock price has been in a steady uptrend since, rallying bounce on the  50 day 3 times during the last quarter. The stock is currently up ~9% on the quarter and is near its 50 day.

Chill ($NFLX #Earnings 4/18/16)

Chill ($NFLX #Earnings 4/18/16)

Netflix ($NFLX) is set to report Q1 results tonight after the close with consensus at EPS of $0.03 on Revenue of $1.965 bln.