Viewing entries in
Earnings

Electric Slide ($TSLA Earnings Preview)

Electric Slide ($TSLA Earnings Preview)

Tesla will report Q1 results after the bell in a letter to shareholders on its website; conference call starts at 16:30.

The Street is expecting Q1 non-GAAP EPS of ($0.68) vs. ($0.36) last year with non-GAAP rev +45% to $1.6 bln.

Tesla pre-announced Q1 deliveries below guidance due to supply/production issues with the Model X.


Guidance:

  • Because production is now on plan and Q1 orders exceeded Q1 deliveries by a wide margin, with Q1 Model S orders being 45% higher than Q1 last year, Tesla reaffirmed its full-year delivery guidance of 80-90K vehicles. By year-end, Model S gross margin should begin to approach 30% and Model X gross margin should be about 25%, with continued improvement for Model X in 2017. Tesla also guided for op-ex up 20% YoY.
  • Tesla may have to raise capital sometime this year given its cash burn. Model 3 deliveries are targeted for late 2017 but they won't start in earnest until 2018. Musk has said Tesla learned from its mistakes in missing Model S and Model X production targets.

TODAY:

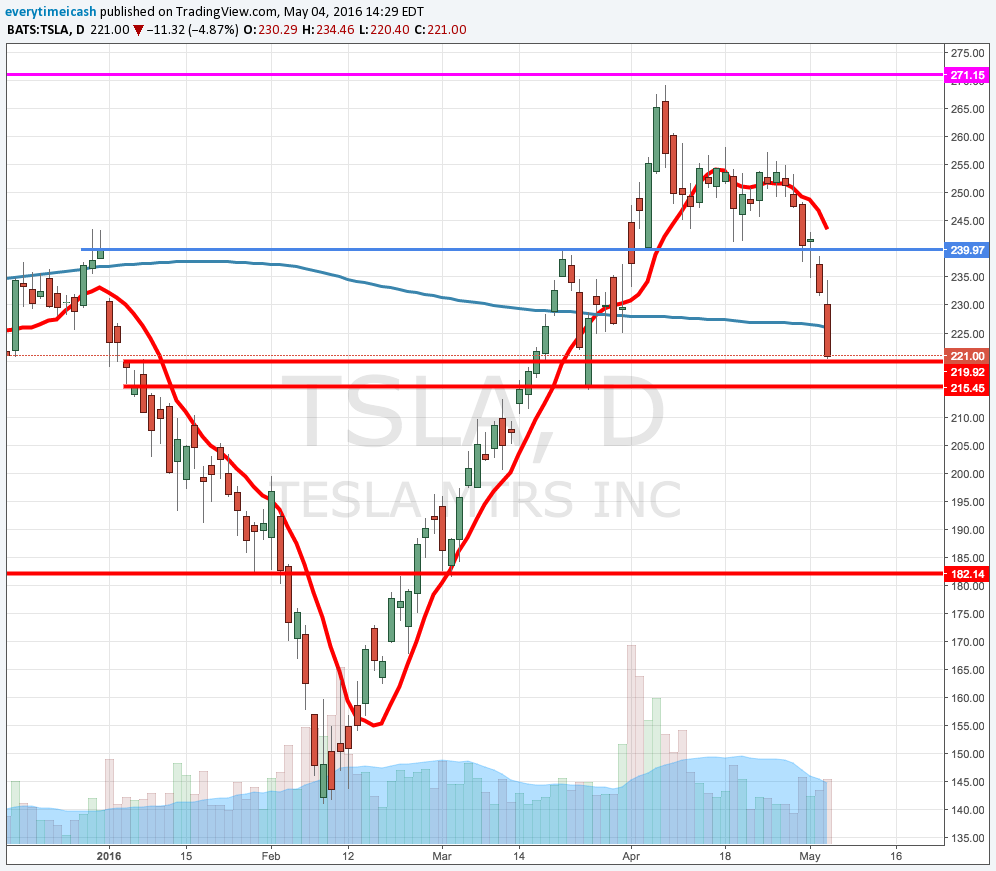
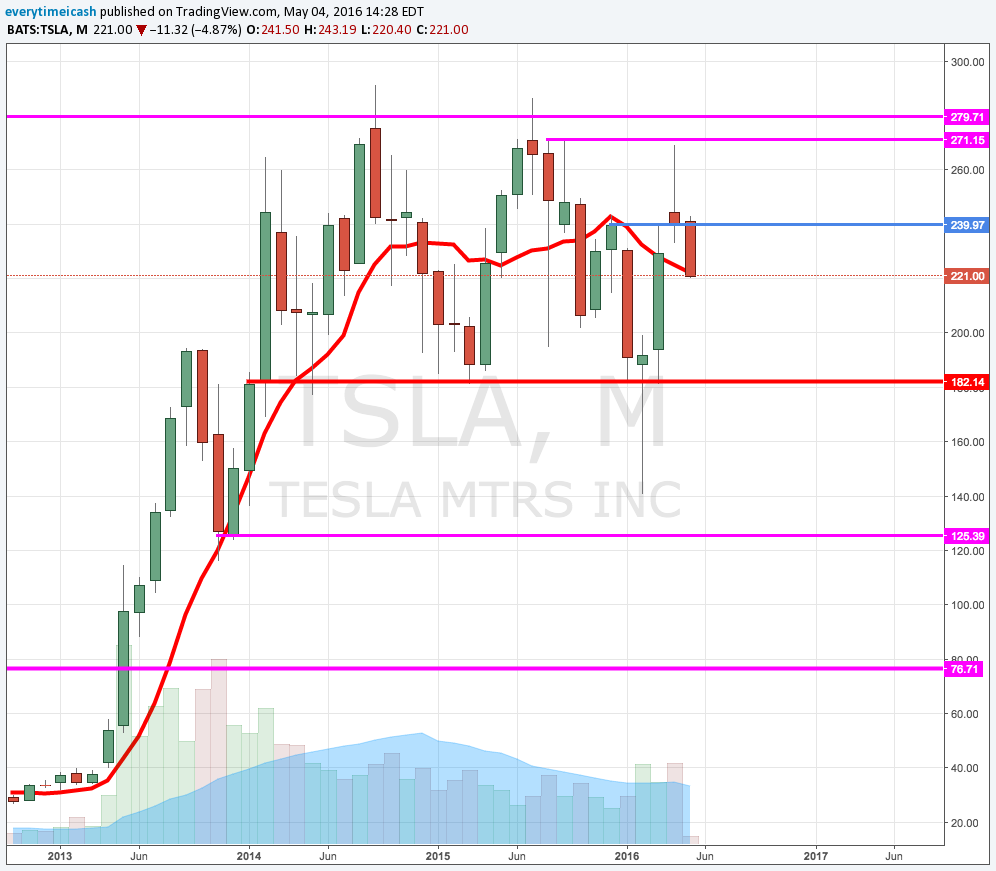
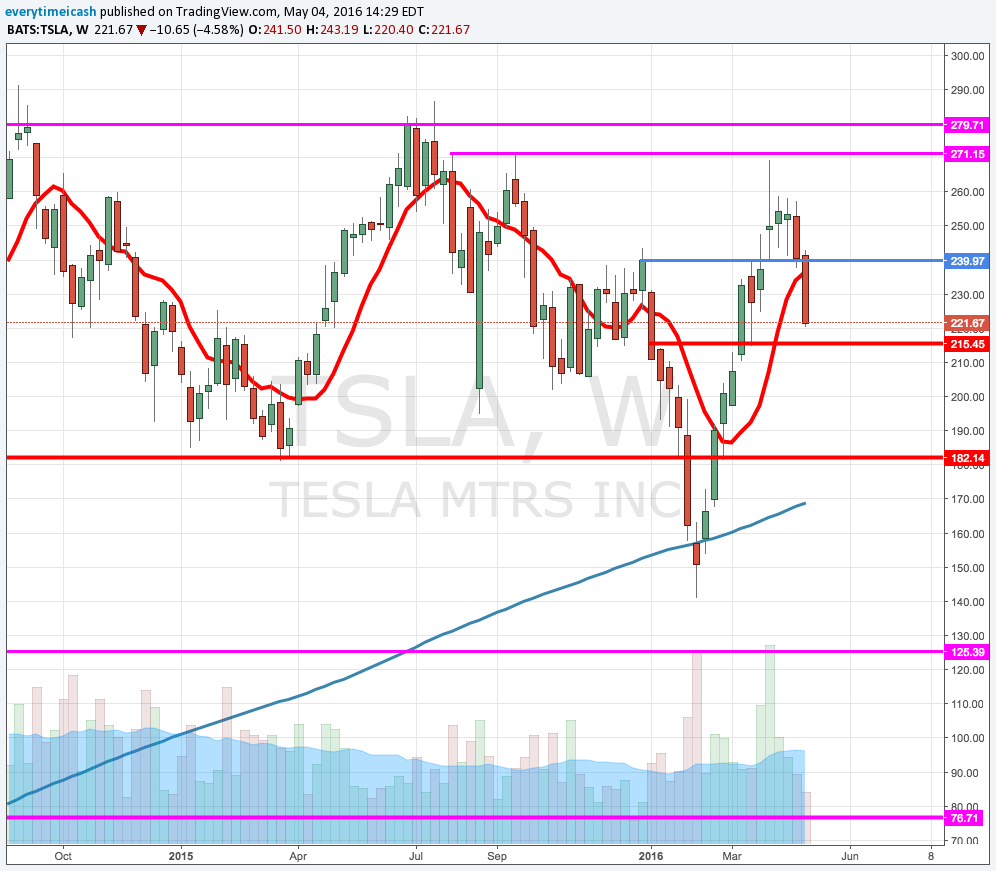
TSLA fell back below the critical 240 level in the market's recent pullback. Shares have come under pressure today following reports that two VPs of manufacturing are leaving the company. 

Shares are trading lower by $10.15 at $222.17 in Wednesday's session. The double whammy of hedge fund manager Jim Chanos and high level exiting the company has longs extremely nervous about its Q1 report due out after the close.

RESULTS:

  • Reports Q1 (Mar) loss of $0.57 per share, excluding non-recurring items, $0.10 better than the Capital IQ Consensus of ($0.67); revenues rose 45.1% year/year to $1.6 bln vs the $1.6 bln Capital IQ Consensus. 
  • Preannounced Q1 deliveries of 14,820, below 16K guidance and Model S orders +45% on April 5th.
  • In Q2, we expect to produce about 20,000 vehicles, representing a sequential increase of nearly 30%, and will deliver as many of these cars as we can in Q2, with the rest being delivered in Q3. Due to a large number of vehicles in transit to customers in Europe and Asia at end of quarter, Q2 deliveries are expected to be ~17,000 vehicles. Importantly, now that supply chain constraints have been resolved, we plan to exit Q2 at a steady production rate of 2,000 vehicles per week, thus laying the foundation for a strong Q3 delivery number.
  • Looking out beyond Q2, we remain confident that we can deliver 80,000 to 90,000 new Model S and Model X vehicles in 2016. This is due to the growing demand we are seeing for Model S and Model X, the improved rate of production that we project for Q2, and the production increases planned for the back half of 2016. Model S cost reductions and improving Model X manufacturing efficiency should cause Automotive gross margin to increase. We are on plan for Model S non-GAAP gross margin to approach 30% and Model X non-GAAP gross margin of about 25% by year-end, with higher Model X gross margin in 2017. 
  • Given the demand for Model 3, we have decided to advance our 500,000 total unit build plan (combined for Model S, Model X, and Model 3) to 2018, two years earlier than previously planned. Increasing production five fold over the next two years will be challenging and will likely require some additional capital, but this is our goal and we will be working hard to achieve it. We remain on plan to make the first cells at the Gigafactory in Q4 2016, and we are adjusting our plans there to accommodate our revised build plan.
  • Given our plans to advance our 500,000 total unit build plan, essentially doubling the prior growth plan, we are re-evaluating our level of capital expenditures, but expect it will be about 50% higher than our previous guidance of $1.5 billion for 2016. Naturally, this will impact our ability to be net cash flow positive for the year, but given the demand for Model 3, investing to meet that demand is the best long-term decision for Tesla. Non-GAAP operating expenses should increase by about 20- 25%, up from +20%.

Tesla Motors (TSLA) reported largely in-line Q1 results last night after the company preannounced Q1 deliveries below guidance last month due to Model X production issues. More importantly, Tesla announced very aggressive production targets that seemingly make a capital raise inevitable.

Encouragingly, production has picked up and demand for the Model S accelerated in Q1, with orders up 45% year over year.

Tesla now plans to build 500K vehicles (Model S, X and 3) in 2018, two years earlier than previously planned. Tesla is planning to build 100-200K Model 3s in the second half of 2017. Elon Musk said there is a high probability you will receive your Model 3 in 2018 if you place a reservation right now. Before last night's news, analysts may have assumed a new reservation wouldn't land you a Model 3 until 2019.

Notably, many were skeptical that Tesla could hit the 500K target in 2020.

As a result, Tesla raised operating expense (to 20-25% growth from +20%) and capital expenditure guidance (~50% from $1.5 billion previously) and backed off its non-GAAP profitability and positive free cash flow targets for 2016.

Both the Bulls and Bears have something to chew on by this news. Bears will say it's an unrealistic product target that will require an excessively dilutive capital raise. But TSLA bulls have faith in their ambitious CEO. Successful execution will put the company even further ahead of the incumbent auto makers in the electric vehicle market and even the tech giants like Apple and Google planning an entrance in the auto market.

Tesla is now even more so a story of manufacturing execution. Much faith is required in Elon Musk, especially at this $28 billion valuation.

Tesla shares are 5% lower today after Elon Musk raised the stakes yet again and signaled an inevitable capital raise.

Late For Work ($LNKD Earnings Preview)

Late For Work ($LNKD Earnings Preview)

'Yeah, so the online business, it has been decelerating over the last few years. It's a structural decel, if you look at our Subs business in the aggregate... the trajectory of the online business is it's been pretty linear in terms of the year-on-year growth rate.'

It's Amazin ($AMZN)

It's Amazin ($AMZN)

Amazon.com (AMZN) is set to report Q1 earnings today after the close today followed by conference call at 5pm ET. 

Dime Life ($POT Earnings Preview)

Dime Life ($POT Earnings Preview)

POT will be releasing its Q1 earnings results tomorrow pre-market with a call tomorrow at 1:00pm ET. Consensus for POT calls for EPS of $0.15 and revs of $1.1 bln. If realized, that would be an EPS decrease of 66% and a revenue decrease of 29% YoY.

  • Co provided full-year 2016 guidance of $0.90-$1.20 per share.
  • Co also forecasted Q1earnings will fall in the range of $0.10-0.20/share.

Co reported, on Jan 28, Q4 earnings of $0.24 per share, $0.07 worse than the Consensus of $0.31; revenues fell 28.8% year/year to $1.35 bln vs the $1.37 bln Consensus


A big issue all fertilizer companies have is the recent weakness in farmer cash receipts. This hurts product companies like POT. And, potash prices remain weak driven by both demand and supply issues. Nitrogen prices are struggling as well.

Co expects global potash shipments in the range of 59-62 million tonnes, in line with 2015's total of ~60 million tonnes, but above current demand expectations.

Overall, Potash (POT) doesn't just sell potash. The co sells potash, nitrogen and phosphate. Following is the breakdown of how much each contributes to the co's gross margin. 

POT's gross margin exposure by segment: Potash = 56%, Nitrogen = 33%, Phosphate = 11%.


POT's sales volume by region:

  • Potash- North America = 34%, Offshore = 66%

  • Phosphate - North America = 62%, Offshore = 38%

  • Nitrogen- North America = 87%, Offshore = 13%

Other fertilizer stocks include AGU, BG, CF, UAN, IPI, TNH, MOS, RTK, RNF. POT's closest peers.

POT has 2.27k May 17.5P trading today.

Like Me ($FB Earnings Preview)

Like Me ($FB Earnings Preview)

Unlike many other companies, expectations for Facebook remain quite high.  Failure to meet those expectations could cause a material decline in its stock, which is up 31% over the last 52 weeks.

Ad spending drives Facebook's top line, accounting for 95% of the company's revenue in 2015. FB is a barometer for how advertisers are spending and where they are allocating their advertising budgets.

Facebook has a large international presence with 86% of its 1.59 billion monthly active users at the end of 2015 residing outside the U.S. and Canada and 50% of its total 2015 revenue derived outside the U.S. and Canada. Facebook, then, will have some revealing insight to share on global economic activity and the impact of foreign currency on its operating results. 

Facebook is a leadership stock for the Nasdaq and Nasdaq 100. The company and its stock serve as guides for the enthusiasm surrounding the growth of social media

  • Facebook had 1.59 billion monthly active users as of December 31.  Any company with that many users/customers warrants a closer look when it reports earnings.
     

FB 4th Quarter: 

  • Daily active users (DAUs) were 1.04 billion on average (+17% year-over-year); mobile DAUs were 934 million on average (+25% year-over-year)
  • Monthly active users (MAUs) were 1.59 billion (+14% year-over-year); mobile MAUs were 1.44 billion (+21% year-over-year)
  • The average price per ad was up 21% while total ad impressions increased 29% year-over-year; that was the first quarter since Q3 2013 that total ad impressions increased on a year-over-year basis
  • Faces tougher comparisons given the strong 2015 performance
  • 2016 will be another significant investment year for Facebook
  • Guidance
    • Non-GAAP expense growth of ~45-55% year-over-year
    • Sees capex in the range of $4.0 billion to $4.5 billion
    • Expects to see FX headwinds, particularly in the first half of the year due to tougher comparisons
       

Tough to be short this stock into earnings, especially at this point.

Affected Stocks:

  • FB
  • Alphabet (GOOG/GOOGL)
  • Twitter (TWTR)
  • LinkedIn (LNKD)
  • Yelp (YELP)
  • PowerShares QQQ Trust (QQQ)
  • Global X Social Media Index ETF (SOCL)
    • FB is largest holding at 12.3% of assets


RESULTS:

Facebook beats by $0.15, beats on revs  

  • Reports Q1 (Mar) earnings of $0.77 per share, $0.15 better than the Capital IQ Consensus of $0.62; revenues rose 51.8% year/year to $5.38 bln vs the $5.26 bln Capital IQ Consensus.
    • Advertising revenue increased 57% y/y to $5.2 bln.
  • Daily active users (DAUs)- DAUs were 1.09 billion on average for March 2016, an increase of 16% year-over-year.
    • Mobile DAUs- Mobile DAUs were 989 million on average for March 2016, an increase of 24% year-over-year.
  • Monthly active users (MAUs- MAUs were 1.65 billion as of March 31, 2016, an increase of 15% year-over-year.

    • Mobile MAUs- Mobile MAUs were 1.51 billion as of March 31, 2016, an increase of 21% year-over-year.

  • Mobile advertising revenue- Mobile advertising revenue represented approximately 82% of advertising revenue for the first quarter of 2016, up from 73% of advertising revenue in the first quarter of 2015.
  • Capital expenditures- Capital expenditures for the first quarter of 2016 were $1.13 billion.
  • Free cash flow for the first quarter of 2016 was $1.85 billion.

🔥🔥MONSTER QUARTER, AGAIN. THEY'RE KILLING THEIR "COMPETITION"🔥🔥


Facebook announces proposal of new class of stock

FB announced that the board of directors has approved a proposal to amend and restate existing certificate of incorporation to create a new class of non-voting capital stock, known as the Class C capital stock.

If approved, it will issue two shares of Class C capital stock as a one-time stock dividend in respect of each outstanding share of our Class A and Class B common stock. This proposal is designed to create a capital structure that will encourage Mr. Zuckerberg to remain in an active leadership role at Facebook. 

The adoption of the proposal is subject to the approval of our stockholders at our 2016 Annual Meeting of Stockholders to be held on June 20, 2016.
— FACEBOOK

Facebook Conference Call Highlights

  • Apps continue to show momentum.
  • Mobile continues to drive growth.
  • Mobile ads being driven by supply and demand; demand- investments to improve solutions

Q1 Avg Price per ad increased 5%; total ad impressions increased 50%; strong growth in mobile ad impressions.

  • Will face tougher comps in 2016 given acceleration of ad growth in 2015
  • Payment fees revenue will also see headwind even with Oculus; expects y/y decline.
  • Expense Outlook remains unchanged at Non-GAAP growth of 45-55%; Amortization will be $700-800 mln; SBC $1.1-1.3 bln in 2016; CapEx will be at the high end of $4.0-4.5 bln range previously given; Q2 and FY16 tax rates should be similar to Q1. 

FB breaks through all time high on stellar report, again. 

$FB prints 119.44 ALL TIME HIGH after hours.

Online Dusty Attic ($EBAY Earnings Preview)

Online Dusty Attic ($EBAY Earnings Preview)

eBay (EBAY) is set to report Q1 results tonight after the close with a conference call to follow at 5pm ET. 

Current Consensus stands at EPS of $0.45 on Revenues of $2.08 bln.

Shares of EBAY were blasted following the Q4 report. EBAY managed to report an in line quarter, but downside guidance to both Q1 and FY16 led to selling pressure that would drop the stock 13%. EBAY shares were able to settle at the $22 level in mid-February and have been able to climb back toward $25 ahead of tonight's report.

An attractive valuation has been the primary driver for the move back through the post-earnings gap down. An attractive valuation is all that's saving the stock right now.

Guidance

  • EBAY expects Q1 revenue in the range of $2.05-2.10 bln; Sees EPS in the range of $0.43-0.45
  • FY16 EPS in the range of $1.82-1.87; Sees revenues in the range of $8.5-8.8 bln.

Key Metrics

  • Total Gross Merchandise Value- Q4 was $21.86 bln which was flat y/y and up approx 11% q/q.
  • Operating Margin- Q4 saw its OpMargin fall 230 bps to 34.4% as FX headwinds and increased competition weighed on results.

Q2 Recap

  • EBAY reported Q4 (Dec) earnings of $0.50 per share, excluding non-recurring items, in-line with the Capital IQ Consensus of $0.50. Revenues were unchanged from the year-ago period at $2.32 bln.
    • GMV was ~flat at $21.9 bln.
  • Co issued downside guidance for Q1, seeing EPS of $0.43-0.45, excluding non-recurring items, vs. then-$0.48 Capital IQ Consensus Estimate; Co projected Q1 revs in the range of $2.05-2.10 bln vs. then-$2.16 bln Capital IQ Consensus Estimate.
  • Co issued downside guidance for FY16, seeing EPS of $1.82-1.87, excluding non-recurring items, vs. then-$1.98 Capital IQ Consensus Estimate. Co projected revenue in the range of $8.5-8.8 bln vs. then-$9 bln Capital IQ Consensus Estimate.
    • EBAY said that it may seek additional outside financing to replace 2016 maturities and provide financial flexibility. So we would be on the look out for any refinancing.
    • EBAY said it expected to continue buying shares throughout 2016, at or above the rate of 2H15. This would be in addition to offsetting dilution. EBAY repurchased $550 mln shares in Q4.

Building A Winner ($SANM Earnings)

Building A Winner ($SANM Earnings)

Sanmina (SANM) consensus stands at EPS of $0.56 on Revenues of $1.59 bln.

SANM is coming off a solid Q1 report. Its EPS were in line and its revenues actually missed expectations, but the revenue miss was expected. However, SANM operating margin was higher than expected and its Q2 guidance was also above consensus. The stock jumped 8% in reaction and has been a steady performer since as it would rally through a slew of key moving averages to push to $23.50.


Shares were ~30% higher from when it reported Q1 results. The stock has retraced back to its 50MA ahead of tonight's report. The decline is most likely some profit taking after a strong run during the quarter. The stock is sitting on its 50MA ($21.80) and has key support in the $21 zone.


Key Metrics

  • Non-GAAP Operating Margin- Q1 came in at 4.0% which was 10 bps higher than expected. Investors would like to see this continue to rise.
  • Share Repurchase- A tailwind for the Q1 results and it is expected to be a driver for Q2. SANM repurchased 1.4 mln shares for a total of $28.7 mln in Q1.

Q2 Guidance

  • SANM said it expects revenue to be in the range of $1.55-1.65 bln.
  • EPS is expected to be in the range of $0.55-0.59.

Q1 Recap

SANM reported Q1 (Dec) earnings of $0.58 per share, excluding non-recurring items, in-line with the Consensus of $0.58. Revenues fell 9.9% year/year to $1.53 bln vs the $1.59 bln Capital IQ Consensus.

  • Ending cash and cash equivalents were $398.4 million
  • Cash flow from operations was 62.7 million
  • Repurchased 1.4 million common shares for $28.7 million
  • Inventory turns were 6.2x Cash cycle days were 47.2 days.
  • Co issued Q2 EPS guidance in the range of $0.55-0.59, excluding non-recurring items, vs. then-$0.52 Consensus Estimates. Co projected Q2 revenues in the range of $1.55-1.65 bln vs. then-$1.57 bln Capital IQ Consensus Estimate.

RESULTS

Sanmina beats by $0.07, beats on revs; guides Q3 EPS in-line, revs in-line  

  • Reports Q2 (Mar) earnings of $0.63 per share, excluding non-recurring items, $0.07 better than the Consensus of $0.56; revenues increased 1% year/year to $1.61 bln vs the $1.59 bln Consensus. 
    • Non-GAAP Operating Margin 4.10% compared to 4.00% in Q4.
    • Repurchased 4.0 million common shares for $74.7 million
    • Inventory turns were 6.5x
    • Cash cycle days were 44.6 days
  • Co issues in-line guidance for Q3, sees EPS of $0.61-0.65 vs. $0.61 Capital IQ Consensus Estimate; sees Q3 revs of $1.625-1.675 bln vs. $1.64 bln Capital IQ Consensus Estimate.

$GOOGL Me BRUH

$GOOGL Me BRUH

Alphabet (GOOG, GOOGL) is set to report Q1 results tonight after the close with a conference call to follow at 4:30pm ET. GOOG reported Q4 results at 4:01pm.

Current consensus is looking for EPS of $7.96 on Revenue of $20.38 bln.

KEY METRICS:


  • Revenue Growth- Q4 saw 18% which was a marked improvement from the prior three quarters (13.0%, 11.1%, 11.9%); Expectations are for another 18% y/y increase.
  • Non-GAAP Operating Margin- Increased to 32% in Q4. Google's Core margins were up 320 bps to 47%.
  • Aggregate paid Clicks- Q4 increased 22% q/q on Google websites.
  • Q4 Aggregate cost-per-click- Q4 was down 5% q/q in Q4.

Q4 Recap

GOOGL reported Q4 (Dec) earnings of $8.67 per share, $0.58 better than the Capital IQ Consensus of $8.09. Revenues rose 18.5% year/year to $21.33 bln vs the $20.76 bln Capital IQ Consensus.

Aggregate paid clicks- Q4 +31%; Q3 +23%.

  • Paid Clicks on Google websites- Q4 +40%; Q3 +35%.
  • Paid clicks on member sites- Q4 +2%; Q3 -5%.

Aggregate cost per click- Q4 -13%; Q3 -11%.

  • CPC on Google sites- Q4 -16%; Q3 -16%.
  • CPC on member sites- Q4 -8%; Q3 -4%.

Revenue Segments

  • Google Website revenue +20% y/y
  • Google Network Member websites +7% y/y
  • Google Advertising +17% y/y
  • Google Other Revenues +24% y/y
  • Operating Expense as % of revenue 36% compared to 37% in prior year
  • Free Cash Flow- $4.31 bln compared to $2.81 bln in prior year
  • TAC As a % of revenue- 21% compared to 22% in prior year.

Alphabet misses by $0.46, reports revs in-line

Reports Q1 (Mar) earnings of $7.50 per share, $0.46 worse than the Capital IQ Consensus of $7.96; revenues rose 17.4% year/year to $20.26 bln vs the $20.38 bln Capital IQ Consensus

Revenue Segments

  • Google Websites +20% y/y
  • Google Network Members' Websites 3%
  • Advertising Revenues +16% y/y
  • Google other revenues +24% y/y
  • Q1 Other Bets Revenue $166 mln; Operating Loss ($802) mln
  • Paid Clicks and Cost Per Clicks
    • Aggregate paid clicks- Q1 +29%;Q4 +31%; Q3 +23%.
      • Paid Clicks on Google websites- Q1 +38%; Q4 +40%; Q3 +35%.
      • Paid clicks on member sites- Q1 +2%; Q4 +2%; Q3 -5%.
    • Aggregate cost per click- Q1 -9%; Q4 -13%; Q3 -11%
      • CPC on Google sites- Q1 -12%; Q4 -16%; Q3 -16%.
  • CPC on member sites- Q1 -8%; Q4 -8%; Q3 -4%.
  • Q1 Free Cash Flow $5.23 bln
  • Q1 Effective Tax Rate 18%

It looks like expectations are growing as margins are contracting. This is not a good scenario for a growth company. The longer this goes the more likely the old google days are over.


Baking it In with Hal ($BHI $HAL Earnings Preview)

Baking it In with Hal ($BHI $HAL Earnings Preview)

Geographic Revenue Breakdown


  • North America -- 38.2% of total FY15 revenue
  • Latin America -- 11.4% of total FY15 revenue
  • Europe/Africa/Russia Caspian -- 20.8% of total FY15 revenue
  • Middle East/Asia Pacific -- 21.9% of total FY15 revenue
  • Industrial Services -- 7.7% of total FY15 revenue

Some of the most exciting news in this space in the past year was when Halliburton (HAL) announced an agreement which HAL will acquire all the outstanding shares of Baker Hughes (BHI) in a stock and cash transaction. 

In their last report, Halliburton said, "We are enthusiastic about and fully committed to closing the compelling BHI transaction, and remain confident we can achieve annual cost synergies of nearly $2 billion." BHI is the world's third largest oilfield services company. SLB is the largest and HAL is the second largest. 

Technicals

Technically, BHI remains in context of its downtrend off the 2015 highs, below its down-sloping 200-day moving averages (48/49). Energy as a whole has stabilized during Q1 of this year as Crude rallied back towards four month highs off the Feb lows.

BHI currenty sits along the top of its own 4-month range highs near the $47-area. A positive response to earnings will need to clear this resistance as well as the 200-day ma's above near 48/49. This would ignore more short covering. A negative response to earnings will liekly cause a test support near the 50-day ma's at 43/44, followed by its YTD range lows near 38/40.

HAL

Geographic Revenue Breakdown


  •  North America - 45.9% of total FY15 revenue
  • Latin America - 13.3% of total FY15 reveue
  • Europe/Africa -- 17.7% of total FY15 revenue
  • Middle East/Asia -- 23.1% of total FY15 revenue

In their annual report, Halliburton stated that the Baker Hughes acquisition may not be accretive, and may be dilutive, to their earnings per share in the near term.

A Technical Perspective

Technically, HAL has been on the mend off its January/February lows with a gain of more than 40%. It's recent upward momentum is clearing its longer-term downtrend line with price challenging resistance at the 40/41 area from the latter half of 2015. Expect price to push higher towards 45 on a positive response to earnings. A negative response will likely knock price back down towards the 36/37 followed by 34.

Options Activity

Based on HAL options, the current implied volatility stands at ~ 30%, which is 2% lower than historical volatility (over the past 30 days). Based on the HAL weekly Apr22 straddle, the options market is currently pricing in a move of ~2% in either direction by weekly expiration (Fri).

OIH WILL BE IMPACTED BY THE REPORTS

Sandy B $LVS Earnings

Sandy B $LVS Earnings

Las Vegas Sands misses by $0.18, misses on revs  

  • Reports Q1 (Mar) earnings of $0.45 per share, excluding non-recurring items, $0.18 worse than the Capital IQ Consensus of $0.63; revenues fell 9.8% year/year to $2.72 bln vs the $2.88 bln Capital IQ Consensus. EPS was $0.57 adjusted for Hold, or how lucky the casino was in terms of gambling win.
  • Hold-Normalized Adjusted Property EBITDA was $1.03 Billion - Consolidated Adjusted Property EBITDA was $917.6 Million
    • In Macao: Adjusted Property EBITDA was $510.4 Million - Strong Cost Discipline Drove a 190 Basis Point Improvement in Hold-Normalized Adjusted Property EBITDA Margin to 32.1%. "The operating environment in Macao remained challenging during the quarter; but we do see signs of stabilization, particularly in the mass market. Our focus on the higher margin mass and non-gaming segments and the geographic diversification of our cash flows enabled us to once again deliver in excess of one billion U.S. dollars of hold-normalized adjusted property EBITDA during the quarter... We remain confident that our market-leading Cotai Strip properties, which will be complemented later this year by The Parisian Macao, targeted to open in mid-September 2016, will continue to provide the economic benefits of diversification to Macao, help attract greater numbers of business and leisure travelers, and provide our company with an outstanding and diversified platform for growth in the years ahead."

WYNN Takes a hit after hours with the miss. 

Coke Head Happiness ($KO Earnings Preview)

Coke Head Happiness ($KO Earnings Preview)

Coca-Cola (KO) is scheduled to report Q1 earnings tomorrow, before the opening bell, at 6:55 ET.

Current Consensus is for Q1 EPS of $0.44 (-8% Y/Y) on revenues of $10.2 bln (-5% Y/Y).

  • Current Consensus is for FY 16 EPS $1.95 on revs of $42.3 bln

  • Last quarter, KO beat EPS by $0.01/share w/ revs in-line. 

FY 16 Guidance from Last Q

  • Organic revs expected to grow 4-5%
  • Expects currency neutral income before tax, structurally-adjusted to grow 6-8% in 2016
  • Expects net impact of acquisitions and divestitures to be a four-five point headwind to net revs
  • Expect ~$2-2.5 bln in net share repurchases in 2016
  • Expect comparable currency neutral EPS growth of 4-6%
  • Expect to spend $2.5-3 bln on capex
  • Due to structural changes, co anticipates slightly higher COGS and SG&A
  • Co expect the benefit to equity income from Monster, Coca-Cola Beverages Africa and Coca-Cola European Partners to partially offset that impact at operating income, resulting in a three to four point negative structural impact to income before tax.
  • Look for updates on the below two l/t initiatives
  • $3 bln in productivity savings
  • Additional Notables from Last Quarter
  • Unit case volume was +3% YoY for Q4, and +2% YoY for FY 15
  • Global price/mix grew 2% for quarter and FY 15

TECHS


The stock price has been in a steady uptrend since, rallying bounce on the  50 day 3 times during the last quarter. The stock is currently up ~9% on the quarter and is near its 50 day.

Chill ($NFLX #Earnings 4/18/16)

Chill ($NFLX #Earnings 4/18/16)

Netflix ($NFLX) is set to report Q1 results tonight after the close with consensus at EPS of $0.03 on Revenue of $1.965 bln.