Viewing entries in
Finance

On Instagram Straight Flexin' (FB)

On Instagram Straight Flexin' (FB)

There is little concern that FB will miss estimates this evening. FB is expected to provide an outlook for its Expense Guidance which is expected to come in well above the 2016 outlook of 40-45%.

Cold Pressed (AAPL)

Cold Pressed (AAPL)

No stock is as anticipated, nor will be scrutinized more closely, than the results from Apple, which will report after Tuesday's close

Easy Esso (XOM)

Easy Esso (XOM)

Oil and gas major-giant Exxon Mobil is scheduled to release its Q4 earnings results tomorrow Jan 31 pre-market with a conference call to follow at 9:30 am ET the same day. 


Hail Mary (UAA)

Hail Mary (UAA)

Under Armour (UAA, UA) is set to report Q4 results tomorrow before the market opens with a conference call to follow at 8:30am ET. UAA is expected to report results at 7:15am. Last quarter the co provided its Q3 results at 7am and then provided prepared conference call remarks on its website shortly after the earnings release. Current Capital IQ consensus stands at EPS of $0.25 on revenues of $1.409 bln. 

Guidance

  • Expects Q4 revenues to grow ~20%. (Approx $1.404 bln, Capital IQ consensus $1.409 bln) 
  • Gross margin is expected to be relatively flat versus prior year.
  • Expect operating income in the range of $186-191 million, representing growth of 5-8% y/y.
  • Reaffirmed guidance for FY16, seeing FY16 revs of $4.93 mln vs. $4.94 bln Capital IQ Consensus Estimate. 
  • Reaffirmed 2016 operating income of $440 million to $445 million.
  • On track to achieve 2018 revenue goal of $7.5 billion and expect to grow full year revenues consistently in the low-20s in both 2017 and 2018.
  • Lowered its 3-year CAGR for EBIT to the mid-teens from 23%.
  • Expect annual operating income growth in the mid-teens in each of the next two years; Focus is on investing to 'get big fast'.
  • North America Apparel growth is slowing across the industry. While expect to continue to significantly outpace the apparel industry, the growth rate going forward will be less than expected from Investor Day in 2015.
  • Will invest more heavily in areas that can grow faster such as footwear, direct-to-consumer and international as well as more aggressively enter Sport Fashion, like UAS, and the much broader sports lifestyle category.

Key Issues

  • Border Tax- UAA would be seen as a big loser if a border tax was enacted. It currently has approx 85% of its sales in the United States. It produces approx 65% of its products overseas in China, Jordan, Vietnam and Indonesia. 
  • Valuation- UAA is trading at approx 42x Forward P/E compared to 20x for Nike (NKE). 

Going Coach (COH)

Going Coach (COH)

Coach (COH) is set to report Q2 results tomorrow before the open with a conference call to follow at 8:30 AM ET. Co reported last quarter's results at 6:45 AM ET. Current Q2 Capital IQ consensus stands at EPS of $0.74 (vs. $0.68 last year) on revs up 2% to $1.32 bln.


    Digitally Western (WDC)

    Digitally Western (WDC)

    WDC is expected to report second quarter earnings tonight after the close. There is a conference call scheduled for 17:00 (the company typically guides on the conference call). 


    Watson and Big Blue (IBM)

    Watson and Big Blue (IBM)

    IBM (IBM) will report Q4 results tonight after the bell with a conference call scheduled to start at 5:00 p.m. ET. Usually, IBM reports within the first 10 minutes after the bell.

    Just Chill

    Just Chill

    NFLX had an aggressive International build in 2016. It also increased investment in its original content after so many of its shows (House of Cards, Orange is the New Black, Narcos, Stranger Things, etc) performed so well. The investments were complimented by a price increase that was 75% complete at the end of Q3. 

    Subs will remain topic of focus but investors want to see the company deliver. Especially with Forward P/E at a 145x 2017 earnings. The cash burn in Q3 was $506 mln and NFLX said it expected Q4 to come in at a similar level. 

    Q4 Guidance:

    • Total Streaming- $2.34 bln
      • Contribution Margin 18.8%
      • Total Membership 91.94 mln
      • Net Adds 5.20 mln

    Domestic Streaming

    • Revenue $1.39 bln
    • Contribution Margins 36.9%
    • Total memberships 48.95 mln
    • Net Additions 1.45 mln (Street expectations closer to 1.39 mln)

    International Streaming

    • Revenue $947 mln
    • Contribution Margins -7.9%
    • Total Memberships 43.0 mln
    • Net Additions 3.75 mln (Street expectations are for a slight beat)
    • Total
      • Net Income $125 mln

    Q3 Recap

    • NFLX reported Q3 (Sep) earnings of $0.12 per share, excluding non-recurring items, $0.07 better than the Capital IQ Consensus of $0.05. Revenues rose 31.7% year/year to $2.29 bln vs the $2.28 bln Capital IQ Consensus.
    • Netflix Q3 Domestic Net Additions 0.370 mln vs 0.30 mln guidance; Q4 guidance is for 1.45 mln, expectations were for ~1.00 mln; Q2 adds was 0.16 mln 
    • Netflix Q3 International Net Additions 3.20 mln vs 2.00 mln guidance; For Q4 NFLX expects addition of 3.75 mln, expectations were for ~3.00 mln; Q2 Adds was 1.52 mln 
    • NFLX issued upside guidance for Q4, seeing EPS of $0.13, excluding non-recurring items, vs. $0.08 Capital IQ Consensus Estimate.

    NFLX SET TO TAKE OFF

    The Take:

    Einhorn really put a damper on this stock yesterday as it confirmed an all time high breakout. It seems everyone from Carl Icahn to Einhorn want to take a shot at calling a top in this stock. "Valuation" is the obvious key concern for these guys, but it's all relative to how you value the stock. Take Amazon for example, it has been shot against on valuation for years now. That short selling and top calling has done nothing more than fuel Bezos' land buying spree. 

    NFLX has started to break out of a two year range and has cleared enough room for further upside. I want to play to capture that upside. 

    NFLX SET TO EXPLODE WE WILL TAKE FEB 145 155 CALLS INTO THE PRINT


    Results


    Netflix beats by $0.02, reports revs in-line; guides Q1 EPS above consensus

    • Reports Q4 (Dec) earnings of $0.15 per share, $0.02 better than the Capital IQ Consensus of $0.13; revenues rose 35.9% year/year to $2.48 bln vs the $2.47 bln Capital IQ Consensus.
    • Co issues upside guidance for Q1, sees EPS of $0.37, excluding non-recurring items, vs. $0.17 Capital IQ Consensus Estimate.
    • See 16:10 comment for additional metrics.

    Excerpts from Shareholders Letter:

    • This was the largest quarter of net additions in our history and was driven by strong acquisition trends in both our US and International segments.
    • 15% ASP growth; ASP for the international segment rose 13% year over year; US contribution margin expanded 395 basis points year-over-year to 38.2%. Margin improvement was greater than expected due primarily to higher-than-forecast revenue and the timing of content deals.
    • Our anticipation for a year-over-year decline in domestic net adds reflects a difficult comparison in the year ago quarter where we exceeded our net adds forecast by 27%. Similarly, in our international segment, we will lap our Rest of World launch in January of last year. We also expect a greater membership impact from our content slate in the second half of 2017. On a sequential basis, we believe our strong Q4 results likely pulled forward some net adds from Q1'17 to Q4'16.
    • Targeting global operating income of 7% (Was 4% in Q4).
    • We anticipate the international segment will be slightly contribution profit positive in Q1. We plan on investing over the remaining quarters of 2017 internationally and, as a result, anticipate an international contribution loss in Q2. On a full year basis, we expect international contribution loss to improve substantially year on year.
    • Net Neutrality- Weakening of US net neutrality laws, should that occur, is unlikely to materially affect our domestic margins or service quality because we are now popular enough with consumers to keep our relationships with ISPs stable. On a public policy basis, however, strong net neutrality is important to support innovation and smaller firms. No one wants ISPs to decide what new and potentially disruptive services can operate over their networks, or to favor one service over another. We hope the new US administration and Congress will recognize that keeping the network neutral drives job growth and innovation.
    • We expect our FCF to be around -$2 billion in 2017 vs. -$1.7 billion in 2016, with FCF loss improving sequentially in Q1'17.
    • We are funding our working capital needs through the debt market. In October, we raised $1 billion of senior notes with a coupon of 4.375%, which will reduce our weighted average cost of capital. We will continue to be a regular issuer of debt to finance our investment in original content as we balance our cash needs with the carrying cost of interest expense

    METRICS FROM THE QUARTER

    NFLX Key Metrics Courtesy of Briefing

    FLX CURRENTLY TRADING AT $144 AFTER HOURS WHICH IS ABOVE $1000 PRE-SPLIT

    Gigamon Smashed on Terrible Report

    Gigamon Smashed on Terrible Report

    Gigamon dives -18% on guidance; trading down near $38 after-hours. Next major area of support near June's breakout. This could be a foreshadow for darling stock NVDA IF they ever miss/soften their guidance.

    Bank of America Earnings Report ($BAC)

    Bank of America Earnings Report ($BAC)

    The market will be paying close attention to several reports from the banking industry on Friday morning. The two "most important" being Bank of America and JP Morgan.

    Alphabetical ($GOOGL Earnings)

    Alphabetical ($GOOGL Earnings)

    Alphabet (GOOGL, GOOG) is set to report Q3 earnings tonight after the close with a conference call to follow at 4:30pm ET. GOOGL reported Q2 results at 4:01pm, the company does not guide. 

    Current Capital IQ consensus stands at EPS of $8.60 on Revenue of $22.03 bln.

    Shares of GOOGL hit an all time high of $838.50 on Monday but we have seen some profit taking ahead of tonight's report as the stock has pulled back to $820. The company is coming of an impressive Q2 in which it was able to accelerate revenue growth to over 20% for the first time in three years.

    The growth was driven by Google website revenues as strength in the mobile and YouTube segments provided a boost. The rise in mobile has also boosted the growth in partners and website TAC which will be an area to watch.

    The all time high will certainly be in play, especially when one views the Forward P/E of 20.5x being reasonable for a co that is posting 20%+ revenue increases despite being a $20+ bln a quarter company, no easy feat. A miss by GOOGL should prove interesting with the $783.50 Post-Q2 results being a key level of support. A break of this will send the shares to the $760 with the 200-sm ($757.29) in play.

    Key Metrics

    • Revenue Growth
    • Operating Margins
    • Aggregate Paid Clicks-  Q3 expected to increase approx 26% y/y; Q2 +29%;-Q1 +29%;Q4 +31%; Q3 +23%.
      • Paid Clicks on Google websites- Q2 +37%;Q1 +38%; Q4 +40%; Q3 +35%.
      • Paid clicks on member sites- Q2 0%;Q1 +2%; Q4 +2%; Q3 -5%.
    • Aggregate cost per click- Q3 is expected to decline approx 5% y/y; Q2 -7%; Q1 -9%; Q4 -13%; Q3 -11%
      • CPC on Google sites- Q2 -9%; Q1 -12%; Q4 -16%; Q3 -16%.
      • CPC on member sites- Q1 -8%; -8%; Q4 -8%; Q3 -4%.
      • If curious: Cost-per-click is defined as click-driven revenue divided by our total number of paid clicks and represents the average cost we charge advertisers for each engagement by users.

    Q2 Recap

    GOOGL reported Q2 (Jun) earnings of $8.42 per share, $0.38 better than the Capital IQ Consensus of $8.04. Revenues rose 21.3% year/year to $21.5 bln vs the $20.77 bln Capital IQ Consensus.

    RESULTS

    GOOGL/GOOG beats by $0.46, beats on revs  

    • Reports Q3 (Sep) earnings of $9.06 per share, $0.46 better than the Capital IQ Consensus of $8.60; revenues rose 20.2% year/year to $22.45 bln vs the $22.04 bln Capital IQ Consensus.
    • Non-GAAP Operating Margin 34% compared to 33% prior year
    • Other Bets revenue $197 mln compared to $141 mln in prior year
      • Other Bets operating loss ($865) mln compared ot ($980)mln in prior year
    • Cost of revenues as %- 39% compared to 38% in prior year
    • Google Website Revenue Growth 23%
    • Google Network Members Websites 1%
    • Google Other Revenues 39%
    • Google segment Revenues 20%
    • TAC as a % of revenue 21% compared to 21% in the prior year
    • Aggregate Paid Clicks-
      • Q3 +33%, expected to increase approx 26% y/y; Q2 +29%;-Q1 +29%;Q4 +31%; Q3 +23%.
      • Paid Clicks on Google websites- Q3 +42%; Q2 +37%;Q1 +38%; Q4 +40%; Q3 +35%.
      • Paid clicks on member sites- Q3 +1%; Q2 0%;Q1 +2%; Q4 +2%; Q3 -5%.
    • Aggregate cost per click-
      • Q3 -11%, expected to decline approx 5% y/y; Q2 -7%; Q1 -9%; Q4 -13%; Q3 -11%
      • CPC on Google sites- Q3 -13%; Q2 -9%; Q1 -12%; Q4 -16%; Q3 -16%.
      • CPC on member sites- Q3 -14%; Q1 -8%; -8%; Q4 -8%; Q3 -4%.

    Primed ($AMZN Earnings Preview)

    Primed ($AMZN Earnings Preview)

    Current Quarter Expectations: As usual, operating income and revenues estimates are near the upper end of AMZN's prior guidance. 

    Alphabetical Order ($GOOGL $GOOG Earnings Preview)

    Alphabetical Order ($GOOGL $GOOG Earnings Preview)

    Alphabet (GOOG, GOOGL) is set to report Q2 results tonight after the close with a conference call to follow at 4:30pm ET. 

    Current Capital IQ consensus stands at EPS of $8.04 on Revenue of $20.77 bln.

    • Q1 GOOGL saw one of the top and bottom line misses (GOOGL does not guide) but the strength of its core business remained evident and a pick up in revenue at some of its 'Other' business units was encouraging for investors. Growth trends remain positive in mobile search, YouTube, and programmatic which should help drive results. Investors would like to see GOOGL produce a beat similar to FB.
    • The stock has been trying to break out ahead of the report as expectations are high. GOOGL will need to meet these expectations in order to rally back to the $800 level for the first time since February.
    • With regards to FB it should be noted that GOOGL's forward P/E stand at 19.3x compared to 25.2x for FB. As arguably the two best tech companies on the planet at the moment these valuations will be watched closely

    Key Things to Watch

    • Revenue Growth
    • Operating Margins
    • Aggregate Paid Clicks- Q1 was down 3% q/q and up 29% y/y; Q4 increased 22% on Google Sites.
    • Q4 Aggregate Cost-Per-Click- 
    • U.K. Exposure

    TECHS:


    Click here to listen to my podcast and learn about my theory on the similarities between relationships and the stock market.


    Jack Be Nimble ($TWTR Earnings Preview)

    Jack Be Nimble ($TWTR Earnings Preview)

    Twitter (TWTR) is set to report Q2 earnings tonight after the close with a conference call to follow at 5pm ET. Current Capital IQ consensus stands at EPS of $0.09 on Revenues of $607.4 mln.

    Like Me ($FB Earnings Preview)

    Like Me ($FB Earnings Preview)

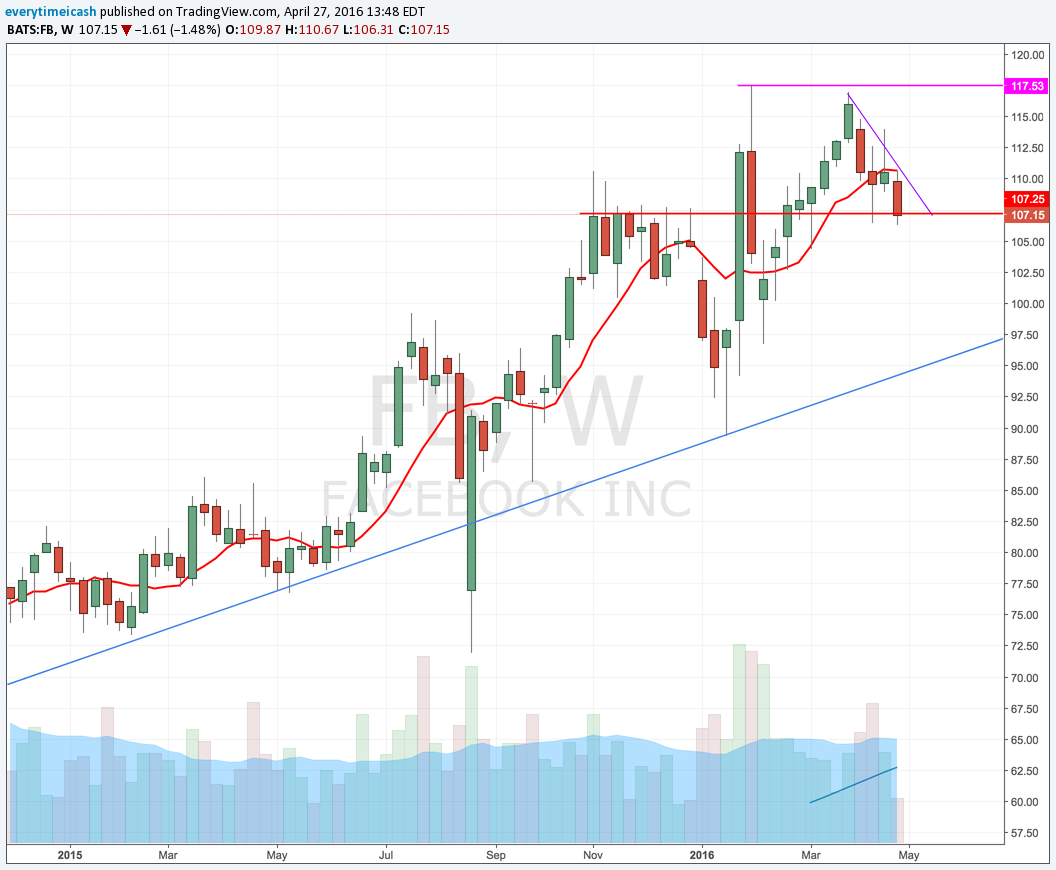
    Unlike many other companies, expectations for Facebook remain quite high.  Failure to meet those expectations could cause a material decline in its stock, which is up 31% over the last 52 weeks.

    Ad spending drives Facebook's top line, accounting for 95% of the company's revenue in 2015. FB is a barometer for how advertisers are spending and where they are allocating their advertising budgets.

    Facebook has a large international presence with 86% of its 1.59 billion monthly active users at the end of 2015 residing outside the U.S. and Canada and 50% of its total 2015 revenue derived outside the U.S. and Canada. Facebook, then, will have some revealing insight to share on global economic activity and the impact of foreign currency on its operating results. 

    Facebook is a leadership stock for the Nasdaq and Nasdaq 100. The company and its stock serve as guides for the enthusiasm surrounding the growth of social media

    • Facebook had 1.59 billion monthly active users as of December 31.  Any company with that many users/customers warrants a closer look when it reports earnings.
       

    FB 4th Quarter: 

    • Daily active users (DAUs) were 1.04 billion on average (+17% year-over-year); mobile DAUs were 934 million on average (+25% year-over-year)
    • Monthly active users (MAUs) were 1.59 billion (+14% year-over-year); mobile MAUs were 1.44 billion (+21% year-over-year)
    • The average price per ad was up 21% while total ad impressions increased 29% year-over-year; that was the first quarter since Q3 2013 that total ad impressions increased on a year-over-year basis
    • Faces tougher comparisons given the strong 2015 performance
    • 2016 will be another significant investment year for Facebook
    • Guidance
      • Non-GAAP expense growth of ~45-55% year-over-year
      • Sees capex in the range of $4.0 billion to $4.5 billion
      • Expects to see FX headwinds, particularly in the first half of the year due to tougher comparisons
         

    Tough to be short this stock into earnings, especially at this point.

    Affected Stocks:

    • FB
    • Alphabet (GOOG/GOOGL)
    • Twitter (TWTR)
    • LinkedIn (LNKD)
    • Yelp (YELP)
    • PowerShares QQQ Trust (QQQ)
    • Global X Social Media Index ETF (SOCL)
      • FB is largest holding at 12.3% of assets


    RESULTS:

    Facebook beats by $0.15, beats on revs  

    • Reports Q1 (Mar) earnings of $0.77 per share, $0.15 better than the Capital IQ Consensus of $0.62; revenues rose 51.8% year/year to $5.38 bln vs the $5.26 bln Capital IQ Consensus.
      • Advertising revenue increased 57% y/y to $5.2 bln.
    • Daily active users (DAUs)- DAUs were 1.09 billion on average for March 2016, an increase of 16% year-over-year.
      • Mobile DAUs- Mobile DAUs were 989 million on average for March 2016, an increase of 24% year-over-year.
    • Monthly active users (MAUs- MAUs were 1.65 billion as of March 31, 2016, an increase of 15% year-over-year.

      • Mobile MAUs- Mobile MAUs were 1.51 billion as of March 31, 2016, an increase of 21% year-over-year.

    • Mobile advertising revenue- Mobile advertising revenue represented approximately 82% of advertising revenue for the first quarter of 2016, up from 73% of advertising revenue in the first quarter of 2015.
    • Capital expenditures- Capital expenditures for the first quarter of 2016 were $1.13 billion.
    • Free cash flow for the first quarter of 2016 was $1.85 billion.

    🔥🔥MONSTER QUARTER, AGAIN. THEY'RE KILLING THEIR "COMPETITION"🔥🔥


    Facebook announces proposal of new class of stock

    FB announced that the board of directors has approved a proposal to amend and restate existing certificate of incorporation to create a new class of non-voting capital stock, known as the Class C capital stock.

    If approved, it will issue two shares of Class C capital stock as a one-time stock dividend in respect of each outstanding share of our Class A and Class B common stock. This proposal is designed to create a capital structure that will encourage Mr. Zuckerberg to remain in an active leadership role at Facebook. 

    The adoption of the proposal is subject to the approval of our stockholders at our 2016 Annual Meeting of Stockholders to be held on June 20, 2016.
    — FACEBOOK

    Facebook Conference Call Highlights

    • Apps continue to show momentum.
    • Mobile continues to drive growth.
    • Mobile ads being driven by supply and demand; demand- investments to improve solutions

    Q1 Avg Price per ad increased 5%; total ad impressions increased 50%; strong growth in mobile ad impressions.

    • Will face tougher comps in 2016 given acceleration of ad growth in 2015
    • Payment fees revenue will also see headwind even with Oculus; expects y/y decline.
    • Expense Outlook remains unchanged at Non-GAAP growth of 45-55%; Amortization will be $700-800 mln; SBC $1.1-1.3 bln in 2016; CapEx will be at the high end of $4.0-4.5 bln range previously given; Q2 and FY16 tax rates should be similar to Q1. 

    FB breaks through all time high on stellar report, again. 

    $FB prints 119.44 ALL TIME HIGH after hours.

    Building A Winner ($SANM Earnings)

    Building A Winner ($SANM Earnings)

    Sanmina (SANM) consensus stands at EPS of $0.56 on Revenues of $1.59 bln.

    SANM is coming off a solid Q1 report. Its EPS were in line and its revenues actually missed expectations, but the revenue miss was expected. However, SANM operating margin was higher than expected and its Q2 guidance was also above consensus. The stock jumped 8% in reaction and has been a steady performer since as it would rally through a slew of key moving averages to push to $23.50.


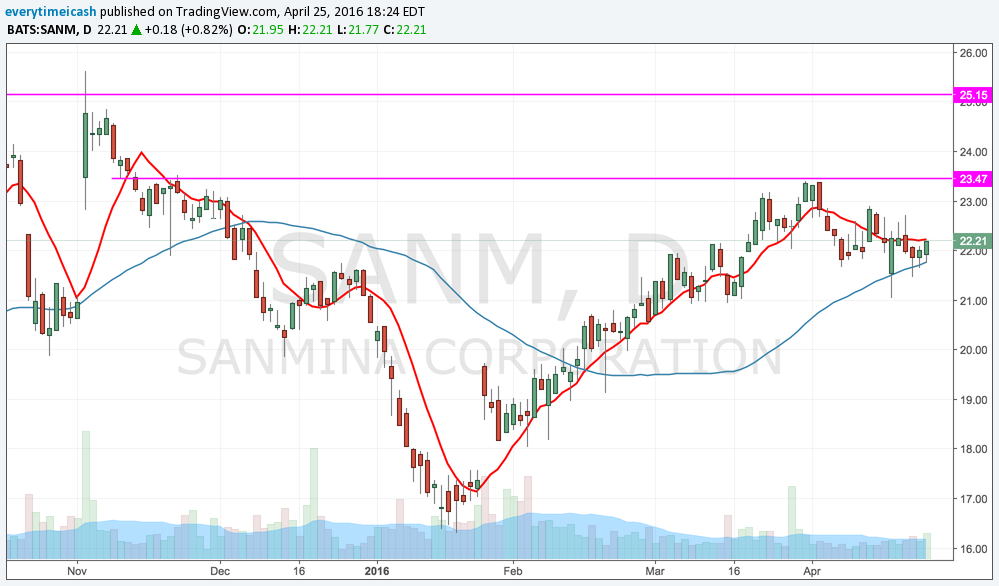
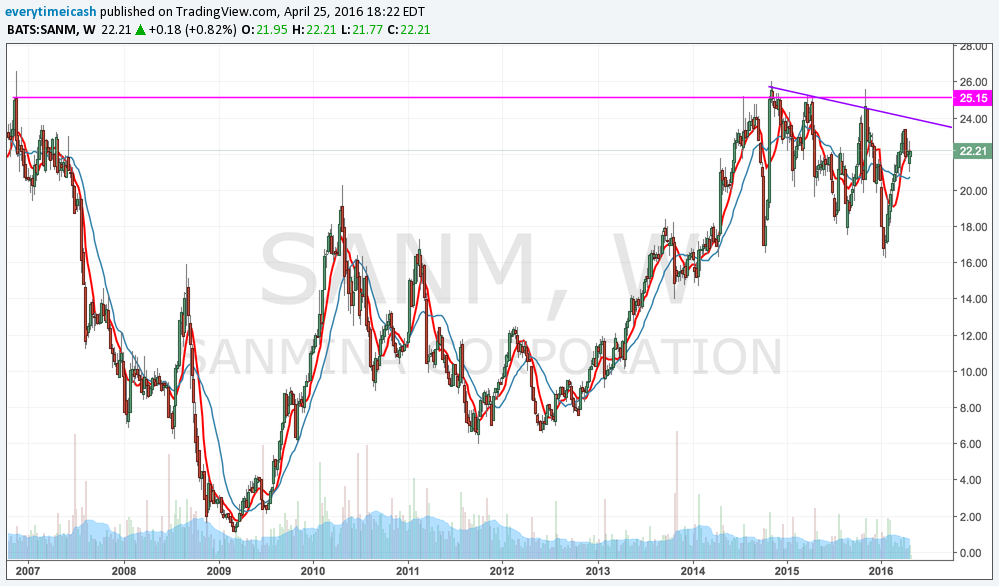
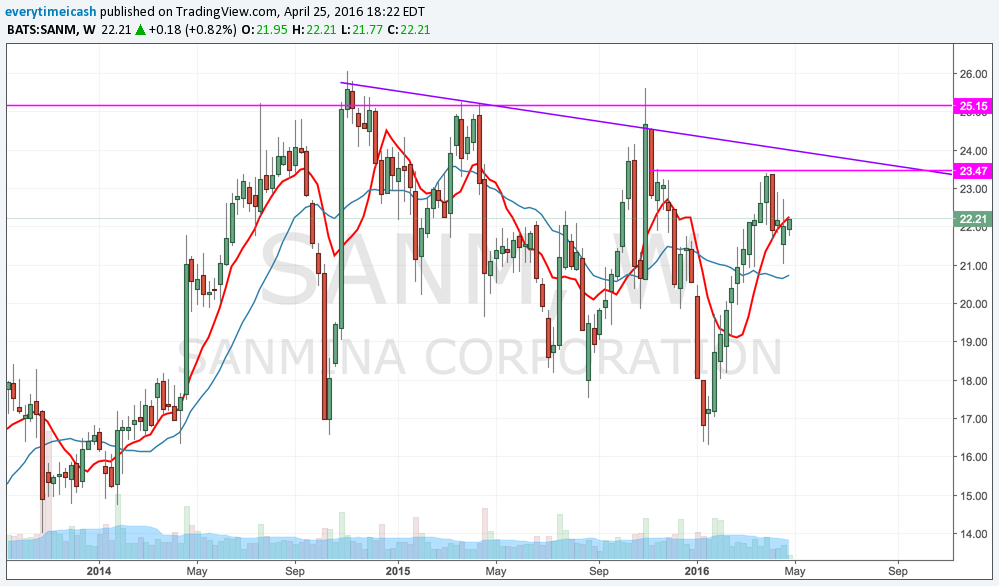
    Shares were ~30% higher from when it reported Q1 results. The stock has retraced back to its 50MA ahead of tonight's report. The decline is most likely some profit taking after a strong run during the quarter. The stock is sitting on its 50MA ($21.80) and has key support in the $21 zone.


    Key Metrics

    • Non-GAAP Operating Margin- Q1 came in at 4.0% which was 10 bps higher than expected. Investors would like to see this continue to rise.
    • Share Repurchase- A tailwind for the Q1 results and it is expected to be a driver for Q2. SANM repurchased 1.4 mln shares for a total of $28.7 mln in Q1.

    Q2 Guidance

    • SANM said it expects revenue to be in the range of $1.55-1.65 bln.
    • EPS is expected to be in the range of $0.55-0.59.

    Q1 Recap

    SANM reported Q1 (Dec) earnings of $0.58 per share, excluding non-recurring items, in-line with the Consensus of $0.58. Revenues fell 9.9% year/year to $1.53 bln vs the $1.59 bln Capital IQ Consensus.

    • Ending cash and cash equivalents were $398.4 million
    • Cash flow from operations was 62.7 million
    • Repurchased 1.4 million common shares for $28.7 million
    • Inventory turns were 6.2x Cash cycle days were 47.2 days.
    • Co issued Q2 EPS guidance in the range of $0.55-0.59, excluding non-recurring items, vs. then-$0.52 Consensus Estimates. Co projected Q2 revenues in the range of $1.55-1.65 bln vs. then-$1.57 bln Capital IQ Consensus Estimate.

    RESULTS

    Sanmina beats by $0.07, beats on revs; guides Q3 EPS in-line, revs in-line  

    • Reports Q2 (Mar) earnings of $0.63 per share, excluding non-recurring items, $0.07 better than the Consensus of $0.56; revenues increased 1% year/year to $1.61 bln vs the $1.59 bln Consensus. 
      • Non-GAAP Operating Margin 4.10% compared to 4.00% in Q4.
      • Repurchased 4.0 million common shares for $74.7 million
      • Inventory turns were 6.5x
      • Cash cycle days were 44.6 days
    • Co issues in-line guidance for Q3, sees EPS of $0.61-0.65 vs. $0.61 Capital IQ Consensus Estimate; sees Q3 revs of $1.625-1.675 bln vs. $1.64 bln Capital IQ Consensus Estimate.

    Chill ($NFLX #Earnings 4/18/16)

    Chill ($NFLX #Earnings 4/18/16)

    Netflix ($NFLX) is set to report Q1 results tonight after the close with consensus at EPS of $0.03 on Revenue of $1.965 bln. 


    Big Blue ($IBM #Earnings Preview)

    Big Blue ($IBM #Earnings Preview)

    Q4 Recap: IBM beat on Q4 non-GAAP EPS of $4.84 vs the $4.81 Capital IQ Consensus and reported revenues in-line at $22.06 bln.