The current street estimates call for EPS of ($0.15), w/ revs +66% y/y to $678.4 mln.

Wolf's Den
The current street estimates call for EPS of ($0.15), w/ revs +66% y/y to $678.4 mln.
The current Capital IQ Consensus Estimates call for Q1 EPS of $0.36 on revenues of $12.03 billion
Current street estimates call for GAAP breakeven EPS on revs of $86.64 mln. Etsy's earnings the last two quarters have hit the wires within the first five minutes after the market has closed. In the event ETSY discusses its forward looking guidance, here are the current street expectations for Q1 and FY16
Q1: GAAP EPS of ($0.04), w/ revs +29.4% y/y to $75.74 mln
After dropping to fresh post-IPO lows just above $6.00 (The IPO priced at $16.00 and opened at $31.00 on 4/16/15) earlier this year, shares have seen some recent interest following the disclosure of new positions taken in Q4 by hedge funds Paulson & Co and Kerrisdale Capital. Still, shares are down 50% from the IPO pricing and 78% from their all-time highs seen its first day of trading. Growth continues to be closely watched amid competition from Amazon and eBay.
Reported Q3 (Sep) loss of $0.06 per share, in-line with the two analyst estimate of ($0.06); revenues rose 38.0% year/year to $65.7 mln vs the $66.39 mln Capital IQ Consensus.
GMS was $568.8 million, up 21.7% compared with the third quarter of 2014. Growth in GMS was driven by 19.4% year-over-year growth in active sellers and 24.9% year-over-year growth in active buyers.
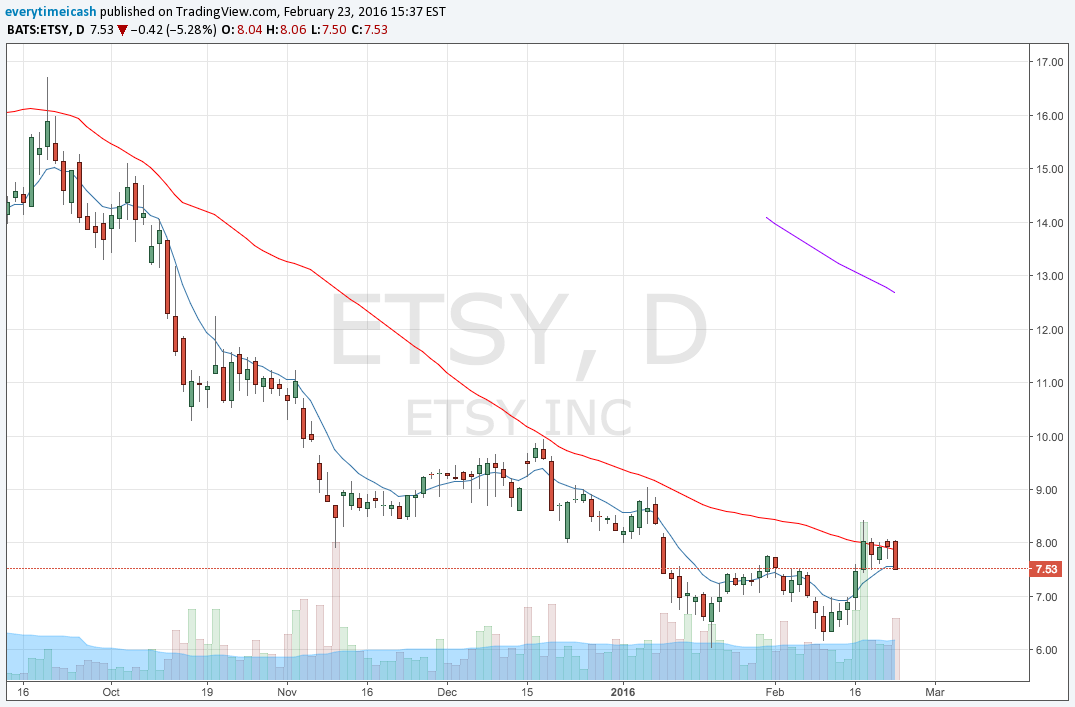
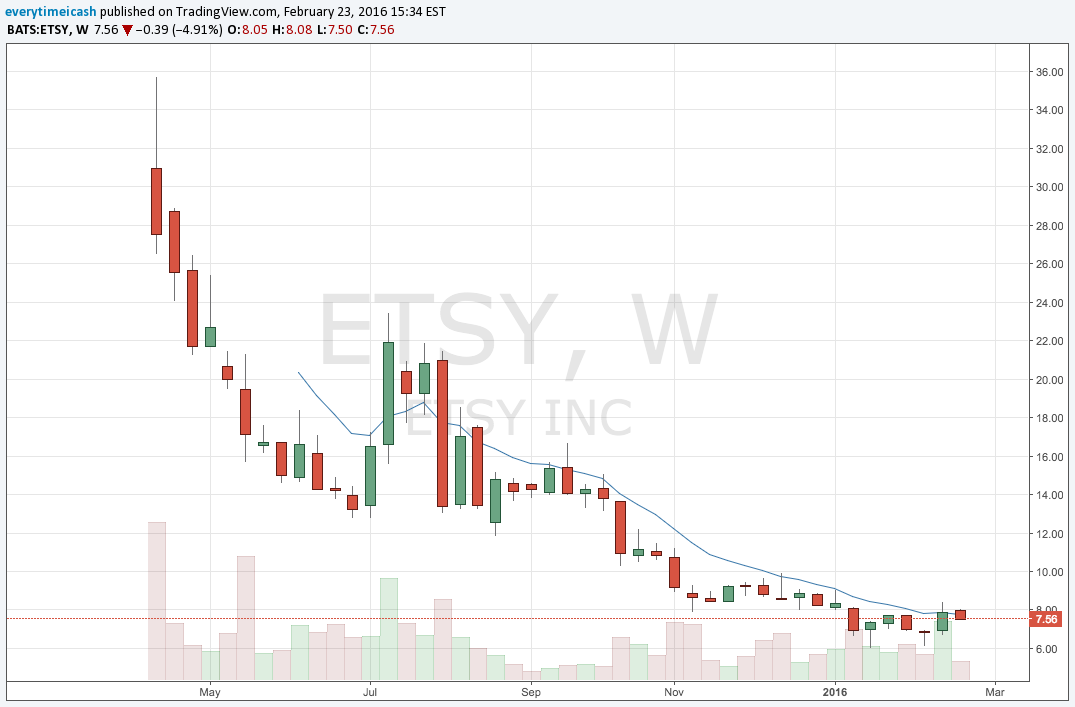
With recent institutional adds and with what appears to be a rounding bottom downside risk is limited in this one.
"We expect to achieve a three-year revenue CAGR in the 20-25% range and a three-year GMS CAGR in the 13-17% range. In 2016, we expect revenue growth to be at the high end of our three-year range and GMS growth to be near the mid-point of our three-year range... We expect to exit 2018 with a full-year gross margin that is in the mid-60s percent range, and that 2016 gross margin will be in this range as well... Finally, from an Adjusted EBITDA margin perspective, we estimate that our margin in 2016 will be comparable to 2015 in the 10-11% range and that it will expand to the high teens range by the end of 2018."
Current Q4 consensus stands at EPS of $0.77 on Revenue of $928 mln
Earnings results from Target (TGT) will be released tomorrow before the open at ~7am ET followed by conference call at 10:30am ET.
TGT results follow earnings from big box peer Wal-Mart (WMT) and precedes Costco (COST) - scheduled to report March 2 after the close. ETFs: Retail HOLDRS Trust (RTH) -- TGT ~5%, Consumer Dis Spdr (XLY) 2%, SPDR Retail (XRT) less than 2%.
Q4 results are in-line with previously guided EPS range of $1.48-1.58 (current consensus is $1.54 on sales -0.5% to $21.6 bln).
Guidance: The company will issue Q1 EPS guidance in the earnings press release and comps guidance during the call
TGT guided for Q4 comps of 1-2% vs +1.5% estimate with digital growth 20%. Q3 comparable sales were +1.9% (near the high end of guidance) and driven primarily by traffic (+1.4% in Q3). Q3 digital sales +20% (well below co's expectation of 30% growth) contributing about 40 bps to comp sales increase. Q3 apparel comp sales grew just under 3% vs nearly 5% in Q2. This slowdown was correlated with warm weather in September. SG&A expenses were solid and in line with expectations. Comps guidance: Co typically discusses any forward looking comps expectations during the conference call.
Margins: Q3 gross margin rate contracted 10 bps to 29.4% (short of co's expectations) and Q3 EBITDA and EBIT margin rates were both ~20 bps higher (consistent with guidance) . Q4 Margin guidance -- gross margin ‘moderate decline' from 28.5% year ago and EBITDA margin rate flat to down slightly from 9.8% last year.
TECHNICAL


Reports Q4 (Jan) earnings of $1.52 per share, $0.02 worse than the Capital IQ Consensus of $1.54; revenues fell 0.6% year/year to $21.63 bln vs the $21.65 bln Capital IQ Consensus.
Q4 comparable sales increased 1.9 percent vs. +1-2% guidance and 1.5% estimates, driven by traffic growth of 1.3 percent. Digital channel sales increased 34 percent, contributing 1.3 percentage points to comparable sales growth. Fourth quarter comparable sales in signature categories (Style, Baby, Kids and Wellness) grew more than three times faster than the company average.
*DATA SOURCE: BRIEFING*
CHK shares are lower by 56% largely due to the drop in energy prices with Earnings tonight.
In the co's most recent 10K filing (issued on February 27, 2015) CHK stated "As of December 31, 2014, we had indebtedness of $11.535 bln, and our net indebtedness represented 30% of our total book capitalization, which we define as the sum of total equity and total current and long-term debt less unrestricted cash. Our level of indebtedness affects our operations in several ways...We may continue to incur cash and noncash charges that would negatively impact our future results of operations and liquidity."
Taking a look at last quarter, the company reported that Q3 production averaged ~ 667,000 barrels of oil equivalent, a YoY increase of 3% adjusted for asset sales. Average daily production consisted of ~ 114,100 barrels of oil, 2.9 billion cubic feet of natural gas and 76,200 bbls of NGL, which represent year-over-year increases of 4%, 2% and 7%, respectively; CHK's 2015 third quarter drilling and completion capital expenditures decreased 41% sequentially to ~ $467 million. The company is also expected to guide for FY16 production and capital. The current FY15 guidance for production is for 670 -- 680 mboe per day. FY15 Capital guidance is $3.4-3.9 bln.
CHK shares have underperformed the Nasdaq so far this year with CHK falling by 15% vs 12% decline in the index.CHK tends to have 5-7% reactions to earnings.
On a positive report, look for resistance near the $3.00 area while support sits near $2.00.
FitBit is down after hours after the company's quarterly report. Though their earnings and revenue easily topped Wall Street's forecast the company totally whiffed on forward guidance due to "extra costs" that they will endure in their latest product manufacturing. Below are the highlighted stats from the quarterly report.
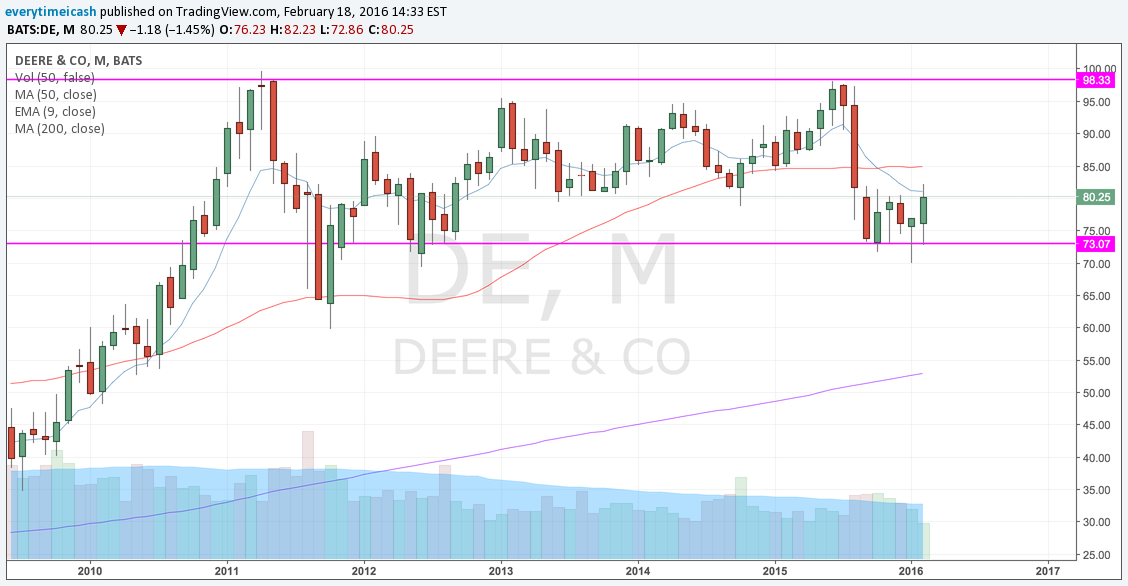
Tomorrow before the open, farm equipment giant Deere (DE) is scheduled to report results with analyst expecting EPS of $0.70 on revs of $4.86 bln. If realized, this would mean a YoY decline in EPS of 38% and a decline in revenue of 13.3% YoY.
Last quarter, on Nov 25, Deere reported Q4 earnings of $1.08 per share, $0.34 better than the Consensus of $0.74; net sales (ex-financial services, other rev) fell 26.2% year/year to $5.93 bln vs the $6.11 bln Capital IQ Consensus.
Co also provided a mixed forecast...
Co issues upside guidance for Q1, sees Q1 net sales -11% to ~$4.99 bln vs. $4.92 bln Capital IQ Consensus Estimate. Co issues in-line guidance for FY16, sees FY16 net sales -7% to ~$23.97 bln vs. $24.11 bln Capital IQ Consensus; earnings of $1.4 bln. However, Deere says, "Although our forecast calls for lower results in the year ahead, the outlook represents a level of performance that is considerably better than we have experienced in previous downturns."
Industry Peers and some color on recent earnings reports:
Some of Deere's closest competitors have already reported quarterly results, including AGCO and CNHI, which gives some nice color into the state of the global agriculture business.
On Feb 2, AGCO Corp (AGCO) reported Q4 earnings of $0.80 per share, $0.01 better than the Capital IQ Consensus of $0.79; revenues fell 21.2% year/year to $1.96 bln vs the $2.03 bln Capital IQ Consensus.
Fourth quarter regional sales results: North America (18.9)%, Europe/Africa/Middle East 0.9%, South America (33.9)%, Asia/Pacific (4.5)%. Reports inventory reduction of $134 mln compared to year-end 2014 on a constant currency basis. Co issues guidance for FY16, sees EPS of $2.30 vs. $2.39 Capital IQ Consensus Estimate; sees FY16 revs of approximately $7.0 bln vs. $6.95 bln Capital IQ Consensus Estimate.
AGCO said, "Co states: "Softer industry demand for farm equipment across all regions and the unfavorable effects of foreign currency translation are expected to negatively impact AGCO's sales and earnings for 2016... Gross and operating margins are projected to be below 2015 levels due to the impact of lower sales and production volumes, a weaker sales mix and increased investment in product development expenses. Benefits from the company's cost reduction initiatives are expected to partially offset the volume-related impacts..."


Nordstrom (JWN) is set to report Q4 results today February 18 after the close.
Unlike the other department store names, Nordstrom does not report holiday sales -- and has not updated guidance since last quarter's earnings.
Last quarter, JWN fell to multi-year lows after seeing a slowdown that resulted in the huge Q3 miss and lowered full year outlook. The performance was also below company expectations, which the management said was due to softer sales trends that were generally consistent across channels and merchandise categories. Comparable sales were up only 0.9% (missing estimates for the first time in the past year -- and by nearly more than 200 bps) with Nordstrom Rack comps actually declining 2.2%.
Key points:
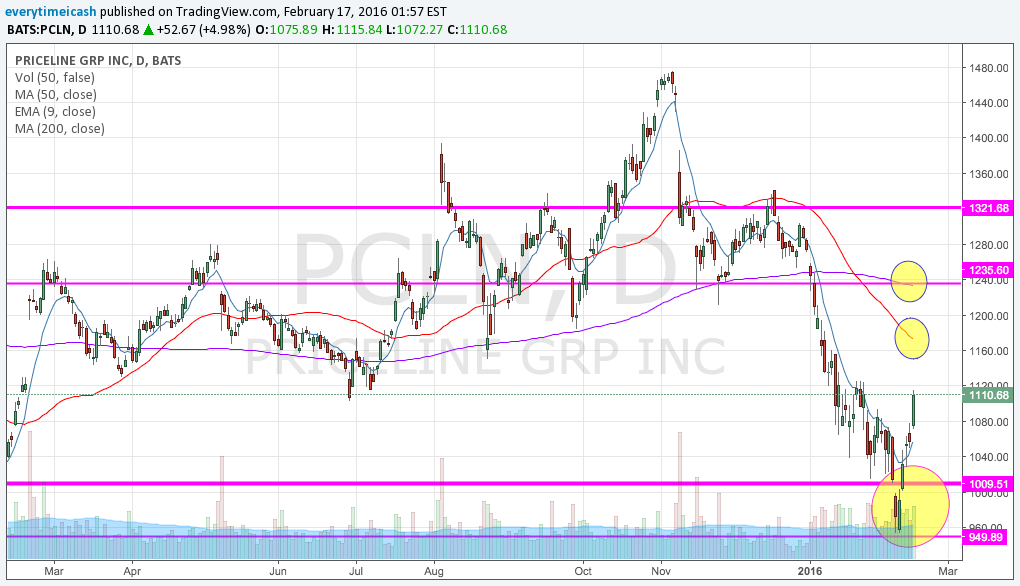
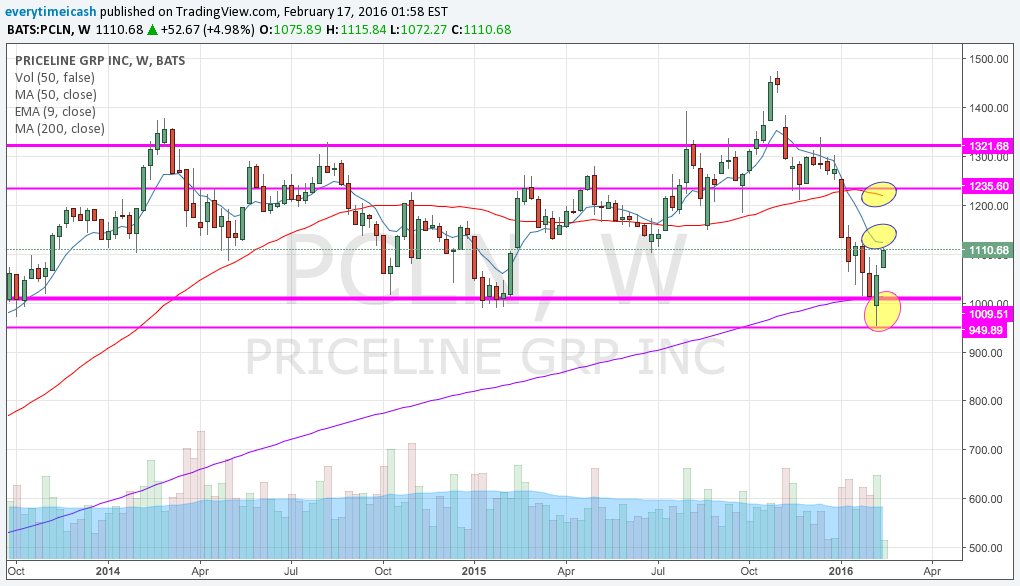
PCLN is expected to report fourth quarter earnings tomorrow before the open. There is a conference call scheduled for tomorrow morning at 7:30 AM ET.
The current consensus is within the company's guidance range of $11.10-11.90 & $1.86-1.99 bln. The company is expected to guide for the first quarter where consensus stands at $9.60 & $2.067 billion.
Gross bookings is the first important metric. Las quarter, the company reported gross travel bookings of $14.8 bln, which was up 7% YoY (or ~22% on a constant currency basis). PCLN's gross profit for the 3rd quarter was $2.9 billion, a 12% increase from the prior year (approximately 29% on a constant currency basis). International operations contributed gross profit in the 3rd quarter of $2.6 billion, an 11% increase versus a year ago (~ 29% on a constant currency basis).
Looking ahead to the fourth quarter, the company is expecting total gross travel bookings to increase ~1-8% (an increase of ~13-20% on a constant currency basis). International gross travel bookings are expected to increase 3-10 in Q4 (or ~17-24% on a constant currency basis).
The next area of interest will be adjusted EBITDA. Adjusted EBITDA for the 3rd quarter 2015 was $1.6 billion, an increase of 12% versus a year ago. Looking ahead to the fourth quarter, the company is expecting adjusted EBITDA of $710-760 mln (versus $712 mln in the same quarter as last year.
Options Activity
Technical Perspective
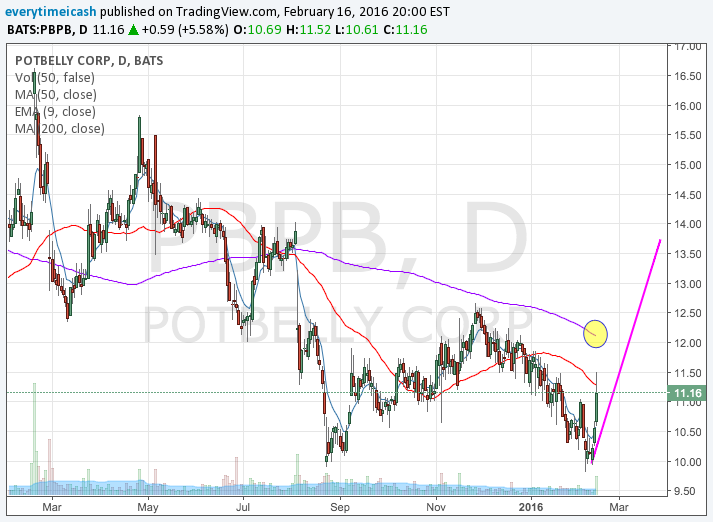
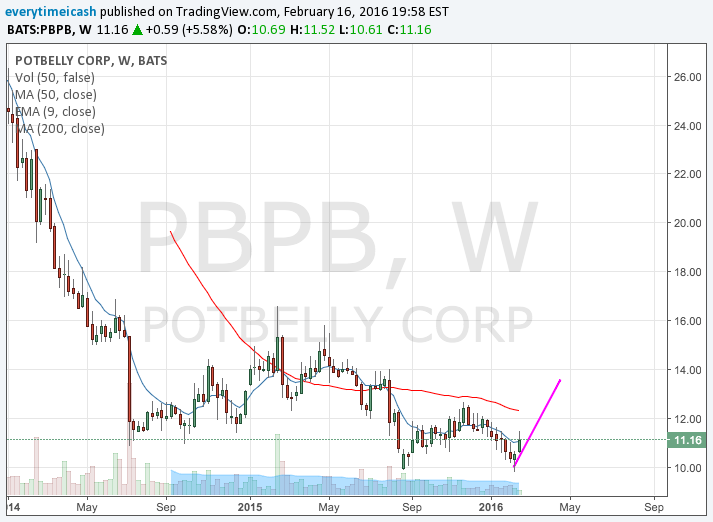
Potbelly Tuesday announced that its fourth quarter ER exploded 76% as they benefitted from high sales and kept their costs low.
Reports Q4 (Dec) earnings of $0.08 per share, $0.02 better than the Capital IQ Consensus of $0.06; revenues rose 12.1% year/year to $95.1 mln vs the $94.86 mln Capital IQ Consensus.
Comps +3.7% vs. ests just above 2%.
For a few months now the street has been asking who is eating Chipotle's lunch (literally and figuratively) well it appears that PotBelly may be seeing an added benefit from the burrito maker's troubles.
The Cheesecake Factory just released their 4th quarter ER results posting an earnings of $0.54 per share and revs of $526.8M.
This is an example of what happens when expectations are just so low and a company doesnt report nearly as bad as everyone is expecting. Looking at the numbers they aren't that great, but they are a beat. The aspect that is troubling to me however is the continued lowball guidance the company issues.
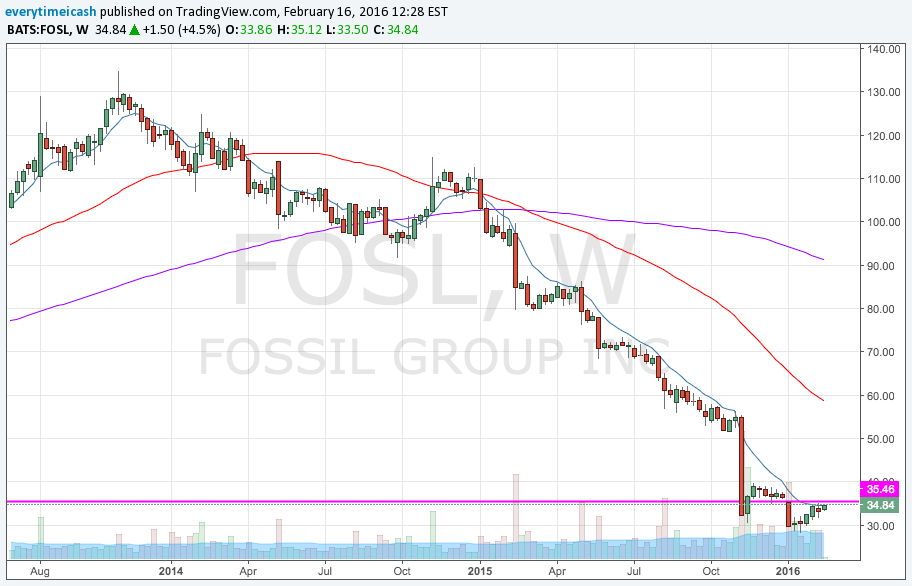
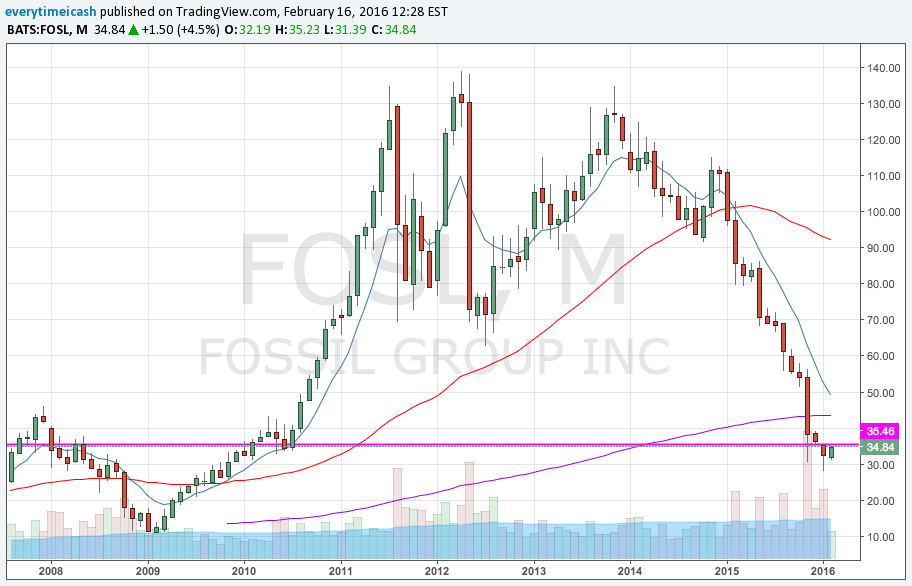
As you can see from the charts above, not much overhead resistance exists until we meet the MA's at ~50/share
Shares of Rackspace Hosting were off over 8% in the after market session after the cloud-computing company posted lower quarterly earnings yet again. The highlights are as follows:
Guidance Details: Excluding the expected negative impact of currency movements and a small divestiture, we expect our normalized year-over-year growth rate for the quarter to range between 9.2 percent and 10.2 percent.... Excluding the expected negative impact of currency movements and a small divestiture, we expect our normalized growth rate for the year to range between 6 percent and 10 percent. Adjusted EBITDA margins are expected to range between 33 percent and 35 percent for the first quarter and the full year.
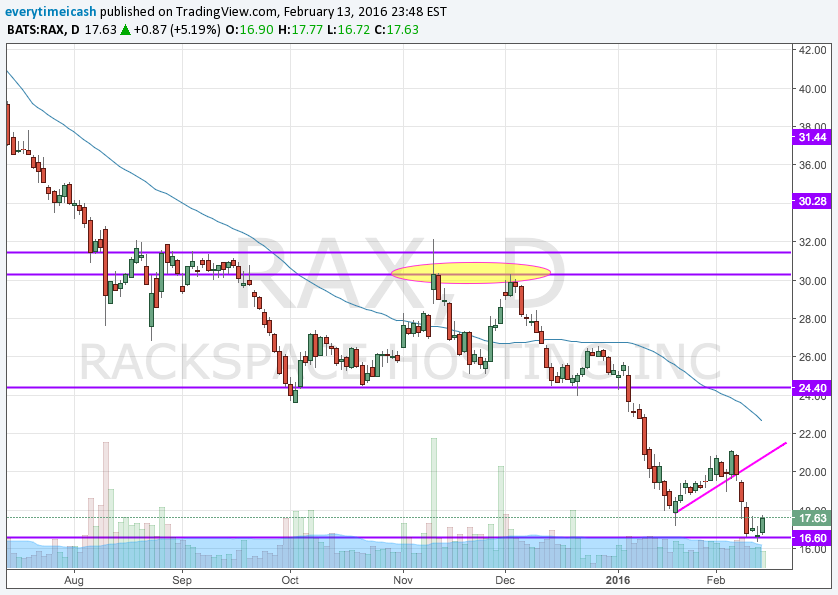
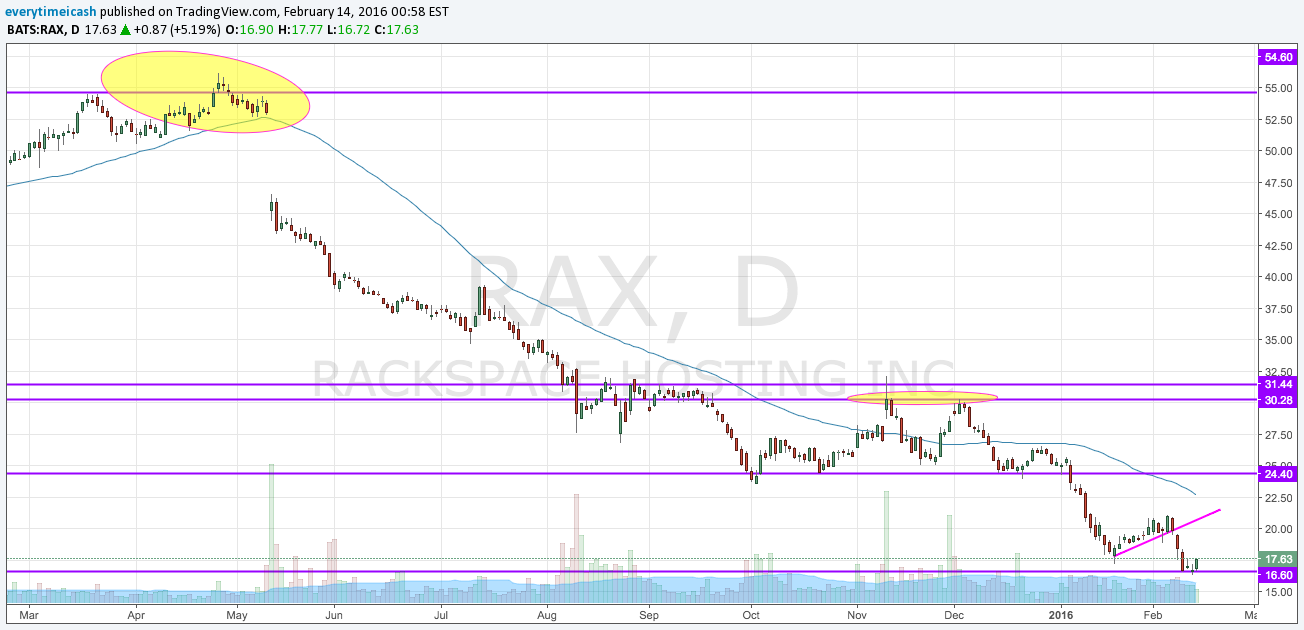
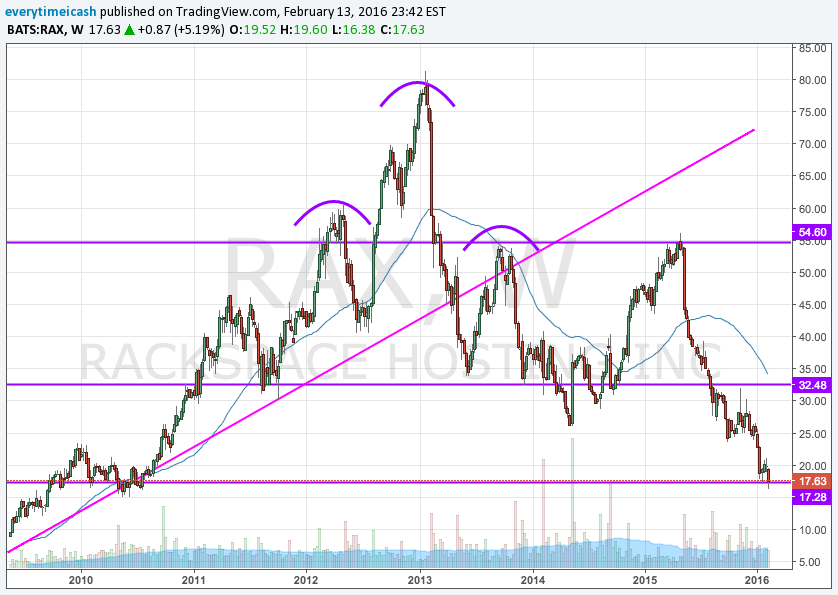
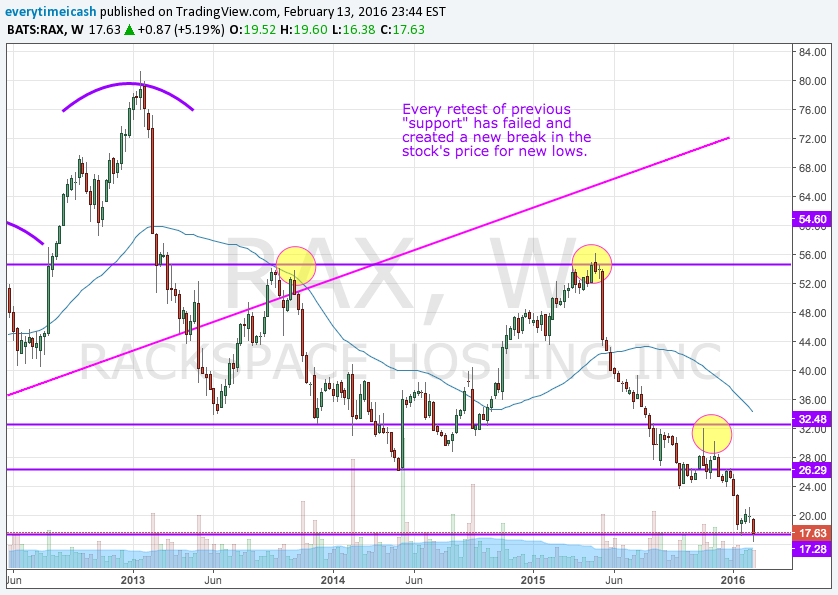
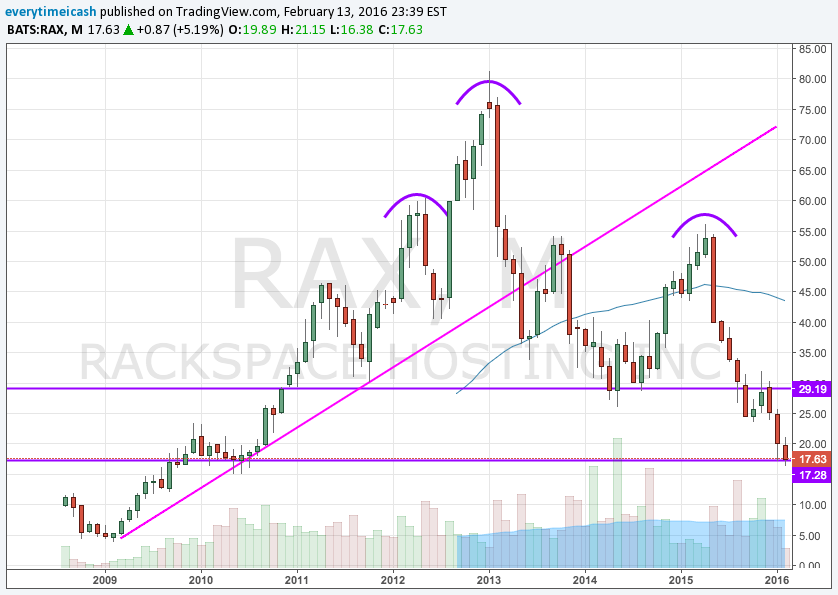
There is no solace in any of these charts.
This company started seeing issues last year as AWS started beefing up its cloud business. Last May management blamed its struggles on currency rates and one time costs, but as we've learned in the last 10 months these issues are systemic.
With guidance cut yet again there really hasn't been much hope for the stock and that appears to continue as the stock's off 8% in the aftermarket.
This theme is what we expected before earnings today. As described in the earnings packet.
With a recent spark lit in the gaming space by WYNN and their CEO Steve Wynn, Boyd Gaming (BYD) furthered that sentiment today reporting better than expected earnings after the bell today.
Heres a quick summation of how they did:
The company issued the following commentary:
The fourth quarter of 2015 was a strong conclusion to a year of solid progress for our Company. Our operating teams continued to drive profitable revenue growth, identify additional efficiencies in our business, and successfully leverage new amenities, all of which contributed to our fifth consecutive quarter of revenue and double-digit Adjusted EBITDA growth. We were particularly encouraged by the performance of our Las Vegas Locals business, as a strengthening economy and effective marketing programs resulted in the segment's strongest fourth-quarter results since 2007. After a strong performance in 2015, we are well-positioned for continued growth and success this year."
If BYD opens here tomorrow it will look to make a run for the 9EMA on the Weekly and Daily basis. Above 18 and expect a challenge 20 and potentially a rounded bottom on the monthly.


As markets trend higher, it is commonplace that stocks will receive a multiple that exceeds their "fair market value." This multiple that they are assigned will naturally continue to appreciate and expand so long as the stock in question continues to perform and "meet expectations." This increase and disjointed market perception will assign a "premium" to particular Wall St. darlings and makes for a situation where certain stocks trade well above their reality.
I present to you, Hormel Foods (HRL).
This pig (pun intended) has risen in stock price significantly faster than the S&P 500 in the past year and it's peer group. Hormel's moonshot rise has can be attributed to the following:


What can we say about this piece of crap? No support on the chart, part time CEO, and part time investors.
Shares of TWTR have been under steady selling pressure since hitting $55 last April. The slide has led the stock to all time lows as it trades in the $14 area ahead of tonight's report. A lack of growth in its user base has been a key in driving the stock lower.People are questioning TWTR's viability compared to it's primary social media peer Facebook (FB) which continues to grow at a faster rate despite a user base that is 5x the size. TWTR has also had issues with it's top management as there were four notable departures. A concern for investors as the co is in the midst of a turnaround plan.
The combined issues have led to sentiment dropping to an all time low. Investors would like to see signs that the turnaround is starting to show some rewards despite the departures. And perhaps most importantly investors would like to see a stabilization of the user base.
Excluding SMS Fast Followers, MAUs were 307 million for the third quarter, up 8% y/y, and compared to 304 million in the previous quarter. (4Q15 was 292 mln)
Guidance
Q3 Recap
TWTR reported Q3 (Sep) earnings of $0.10 per share, $0.05 better than the Capital IQ Consensus of $0.05. Revenues rose 57.6% year/year to $569 mln vs the $562.17 mln Capital IQ Consensus.
Disney ($DIS) is set to report Q1'16 earnings after the bell this afternoon, at 4:15pm ET. The company has an earnings webcast scheduled to follow at 5:00pm ET, which can be found on their investor relations page of their website. Disney does not typically provide forward earnings or revenue guidance with its release or during its conference call.
With ESPN being a huge revenue driver, the company was (possibly still is) tied to cable and media networks. Revs from media networks account(ed) for ~31% of the company's revs.
Q4'15 Segment Results
$AKAM reports ER after the bell today. The call is at 4:30pm EST.
Consensus is: EPS of $0.63 (versus $0.70 last year) on revenue of $568.8 mln (+6% YoY). The current consensus is within the company's guidance range of $0.60-0.64 & revenue of $557-577 mln. The company is expected to guide for the first quarter where Capital IQ consensus stands at $0.62 & revenue of $567.9 mln.
The company has said it expects a decline in revenue in Q4 and three of largest US media accounts. With FB showing that ad sales are through the roof this leads me to believe there is a bigger issue here with the management or with the positioning they've taken for the future benefit of the company.
Again, not sure how that was possible with a growth in web traffic. It seems they may need to look forward yet again.
Metrics:
The first area of interest will be various metrics. Taking a look at last quarter, the company reported adjusted EBITDA of $222 mln, which grew 4% over Q3. Adjusted EBITDA margin was 40%, down 3 percentage points YoY. Looking ahead to the fourth quarter, the company expects adjusted EBITDA margins of 40-41%. Looking beyond Q4, the company will strive to operate the company in the 40% to 41% EBITDA range for the foreseeable future.
Taking a look at last quarter, the GAAP gross margin was 67% which was in line with the prior quarter and down 1 percentage point from the same period last year. Looking ahead to the fourth quarter, the company expects GAAP gross margins to come in around 66%. DA Davidson expects 44% of rev from the Media Delivery group, 48% from the Performance and Security group, and the remaining 8% from the Service and Support group. The firm also expects gross margins of 66%, operating margin of 27.9%, and EPS of $0.60, which compares to $0.70 in the year-ago quarter. Q4 is typically a strong seasonal quarter, with online retail activity through the holiday season providing a tailwind to growth.
Options Activity
Technical