Online Dusty Attic ($EBAY Earnings Preview)

Online Dusty Attic ($EBAY Earnings Preview)

eBay (EBAY) is set to report Q1 results tonight after the close with a conference call to follow at 5pm ET. 

Current Consensus stands at EPS of $0.45 on Revenues of $2.08 bln.

Shares of EBAY were blasted following the Q4 report. EBAY managed to report an in line quarter, but downside guidance to both Q1 and FY16 led to selling pressure that would drop the stock 13%. EBAY shares were able to settle at the $22 level in mid-February and have been able to climb back toward $25 ahead of tonight's report.

An attractive valuation has been the primary driver for the move back through the post-earnings gap down. An attractive valuation is all that's saving the stock right now.

Guidance

  • EBAY expects Q1 revenue in the range of $2.05-2.10 bln; Sees EPS in the range of $0.43-0.45
  • FY16 EPS in the range of $1.82-1.87; Sees revenues in the range of $8.5-8.8 bln.

Key Metrics

  • Total Gross Merchandise Value- Q4 was $21.86 bln which was flat y/y and up approx 11% q/q.
  • Operating Margin- Q4 saw its OpMargin fall 230 bps to 34.4% as FX headwinds and increased competition weighed on results.

Q2 Recap

  • EBAY reported Q4 (Dec) earnings of $0.50 per share, excluding non-recurring items, in-line with the Capital IQ Consensus of $0.50. Revenues were unchanged from the year-ago period at $2.32 bln.
    • GMV was ~flat at $21.9 bln.
  • Co issued downside guidance for Q1, seeing EPS of $0.43-0.45, excluding non-recurring items, vs. then-$0.48 Capital IQ Consensus Estimate; Co projected Q1 revs in the range of $2.05-2.10 bln vs. then-$2.16 bln Capital IQ Consensus Estimate.
  • Co issued downside guidance for FY16, seeing EPS of $1.82-1.87, excluding non-recurring items, vs. then-$1.98 Capital IQ Consensus Estimate. Co projected revenue in the range of $8.5-8.8 bln vs. then-$9 bln Capital IQ Consensus Estimate.
    • EBAY said that it may seek additional outside financing to replace 2016 maturities and provide financial flexibility. So we would be on the look out for any refinancing.
    • EBAY said it expected to continue buying shares throughout 2016, at or above the rate of 2H15. This would be in addition to offsetting dilution. EBAY repurchased $550 mln shares in Q4.

Building A Winner ($SANM Earnings)

Building A Winner ($SANM Earnings)

Sanmina (SANM) consensus stands at EPS of $0.56 on Revenues of $1.59 bln.

SANM is coming off a solid Q1 report. Its EPS were in line and its revenues actually missed expectations, but the revenue miss was expected. However, SANM operating margin was higher than expected and its Q2 guidance was also above consensus. The stock jumped 8% in reaction and has been a steady performer since as it would rally through a slew of key moving averages to push to $23.50.


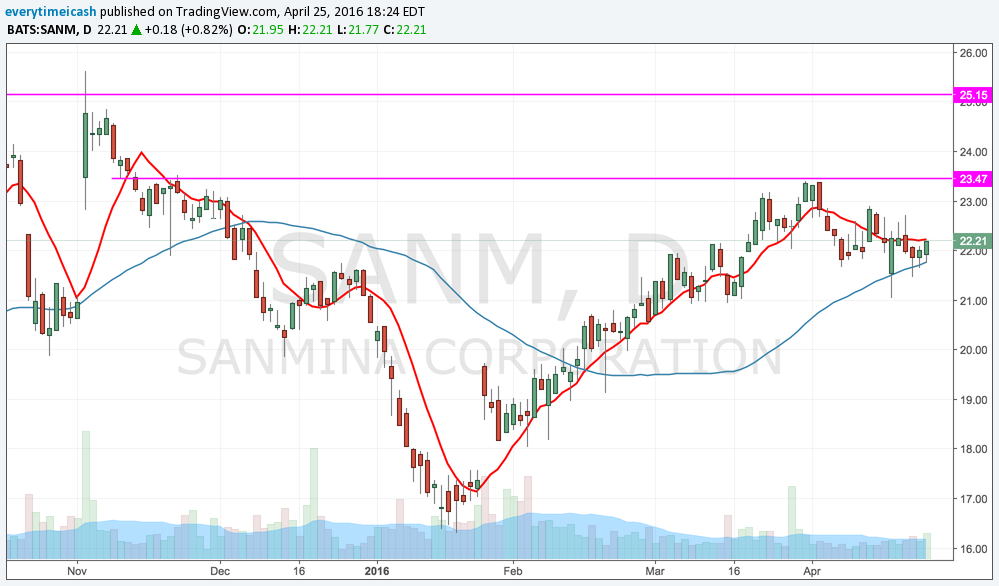
Shares were ~30% higher from when it reported Q1 results. The stock has retraced back to its 50MA ahead of tonight's report. The decline is most likely some profit taking after a strong run during the quarter. The stock is sitting on its 50MA ($21.80) and has key support in the $21 zone.


Key Metrics

  • Non-GAAP Operating Margin- Q1 came in at 4.0% which was 10 bps higher than expected. Investors would like to see this continue to rise.
  • Share Repurchase- A tailwind for the Q1 results and it is expected to be a driver for Q2. SANM repurchased 1.4 mln shares for a total of $28.7 mln in Q1.

Q2 Guidance

  • SANM said it expects revenue to be in the range of $1.55-1.65 bln.
  • EPS is expected to be in the range of $0.55-0.59.

Q1 Recap

SANM reported Q1 (Dec) earnings of $0.58 per share, excluding non-recurring items, in-line with the Consensus of $0.58. Revenues fell 9.9% year/year to $1.53 bln vs the $1.59 bln Capital IQ Consensus.

  • Ending cash and cash equivalents were $398.4 million
  • Cash flow from operations was 62.7 million
  • Repurchased 1.4 million common shares for $28.7 million
  • Inventory turns were 6.2x Cash cycle days were 47.2 days.
  • Co issued Q2 EPS guidance in the range of $0.55-0.59, excluding non-recurring items, vs. then-$0.52 Consensus Estimates. Co projected Q2 revenues in the range of $1.55-1.65 bln vs. then-$1.57 bln Capital IQ Consensus Estimate.

RESULTS

Sanmina beats by $0.07, beats on revs; guides Q3 EPS in-line, revs in-line  

  • Reports Q2 (Mar) earnings of $0.63 per share, excluding non-recurring items, $0.07 better than the Consensus of $0.56; revenues increased 1% year/year to $1.61 bln vs the $1.59 bln Consensus. 
    • Non-GAAP Operating Margin 4.10% compared to 4.00% in Q4.
    • Repurchased 4.0 million common shares for $74.7 million
    • Inventory turns were 6.5x
    • Cash cycle days were 44.6 days
  • Co issues in-line guidance for Q3, sees EPS of $0.61-0.65 vs. $0.61 Capital IQ Consensus Estimate; sees Q3 revs of $1.625-1.675 bln vs. $1.64 bln Capital IQ Consensus Estimate.

At a Crossroad 4/25 Weekly Setups and Preview

At a Crossroad 4/25 Weekly Setups and Preview

With poor earnings from $V $SBUX $GOOGL/$GOOG and $MSFT, the market had every reason to let the bottom fall out and collapse on Friday. Though we started lower, we ended the day slightly in the positive for the S&P 500. The Q's took it early but finished moderately lower. The A/D line continues to broaden and the market continues to catch a bid. Unlike the last couple of years, the broader market participation has been stellar and it seems every couple of weeks there is a rotation into a new group. The main focal point on Friday was the IWM which ended firmly in the green. Until this musical chairs of money rotation ends, there is no reason to believe that the bears have any semblance of control. There are two levels of support currently where dip buyers step in. Near the 9 and the 20MA's. It's important that the momentum continues and the market continues to churn higher as we've broken our downtrends (for now).


RAILS

Entire sector is seeing strength and is reversing its downtrend.

CP

Flagging at its downtrend line and at resistance.

UNP

Broke monthly downtrend and breaking into resistance.

KSU


TSLA

TSLA Flagging into support. 20D better hold. 

Bull Flag, multi-day consolidation.

FEYE

Flagging and ready to break out.

Ready to rip


BIOS

All bio ETF's are ready to rip and some have started to move. 

LABU IBB XBI JUNO CELG AMGN GILD


WLL

Basing for a breakout.

Basing for a breakout

QCOM

"Poor" earnings results but found support and bounced.

Breakout looming

Mister Softee ($MSFT Earnings)

Mister Softee ($MSFT Earnings)

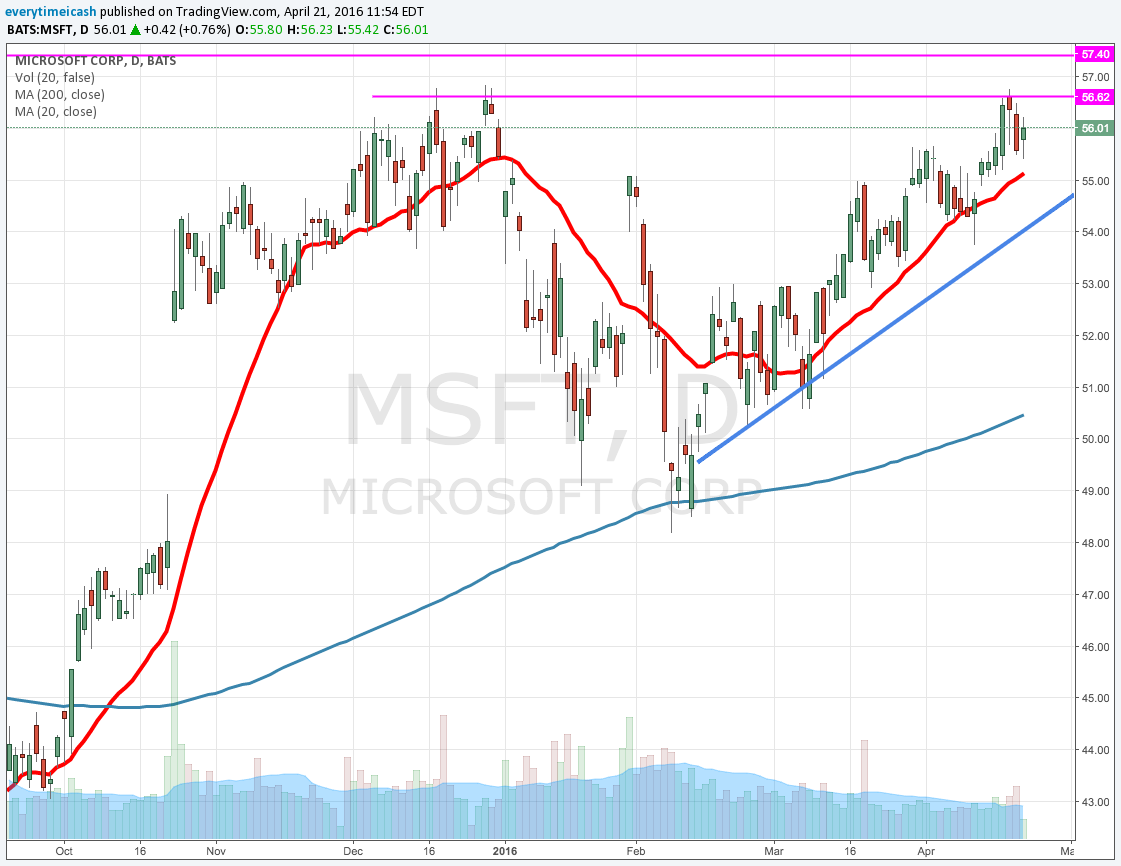
Microsoft is set to report Q3 earnings after the bell. The company releases their earnings results on their website. In addition, there is a conference call scheduled at 5:30pm ET, where management will provide Q4 revenue guidance.

‘Mobile first, Cloud first' strategy

There is no other competitor in the cloud space other than AMZN really. MSFT strategy focused on being that second competitor since they realize they could not overtake the 800lb gorilla in the room known as AWS.


Key Metrics/Guidance


  • Current Consensus calls for adj. EPS of $0.64 on revenues of $22.1 bln.
  • The company provided the following guidance for Q3 revenues:
    • Productivity and Business Processes revs of $6.4-6.6 bln.
    • Intelligent Cloud segment revs of $6.1-6.3 bln .
    • Personal Computing revs of $9.1-9.4 bln.
    • Summing these gives total rev guidance of $21.6-22.3 bln.
  • Management is expected to provide Q4 revenue guidance on the call (segment by segment). Current Consensus calls for Q4 revenues of $23.1 bln.

RESULTS


Microsoft misses by $0.02, reports revs in-line; guides Q3 Q4 revs below consensus on the call   


  • Reports Q3 (Mar) earnings of $0.62 per share, excluding non-recurring items, $0.02 worse than the Consensus of $0.64; revenues rose 1.6% year/year to $22.08 bln vs the $22.11 bln Consensus. 

Productivity and Business Processes rev +1% to $6.5 bln vs. $6.4-6.6 bln guidance.  

  • Office commercial products and cloud services revenue grew 7% in constant currency driven by Office 365 revenue growth of 63% in constant currency
  • Office consumer products and cloud services revenue grew 6% in constant currency with Office 365 consumer subscribers increasing to 22.2 million
  • Dynamics products and cloud services revenue grew 9% in constant currency with Dynamics CRM Online seat adds more than doubling year-over-year.

  • Intelligent Cloud rev +3% to $6.1 bln vs. $6.1-6.3 bln guidance
    • Server products and cloud services revenue increased 5% in constant currency driven by double-digit annuity revenue growth
    • Azure revenue grew 120% in constant currency with usage of Azure compute and Azure SQL database more than doubling year-over-year
    • Enterprise Mobility customers more than doubled year-over-year to over 27,000, and the installed base grew nearly 4x year-over-year.
  • Personal Computing revs +1% to $9.5 bln vs. $9.1-9.4 bln guidance.
    • Windows OEM revenue declined 2% in constant currency, outperforming the PC market, driven by higher consumer premium device mix
    • Surface revenue increased 61% in constant currency driven by Surface Pro 4 and Surface Book
    • Phone revenue declined 46% in constant currency

Xbox Live monthly active users grew 26% year-over-year to 46 million.


Sign Up

For real time trades, market insights, alerts, and in depth analysis.


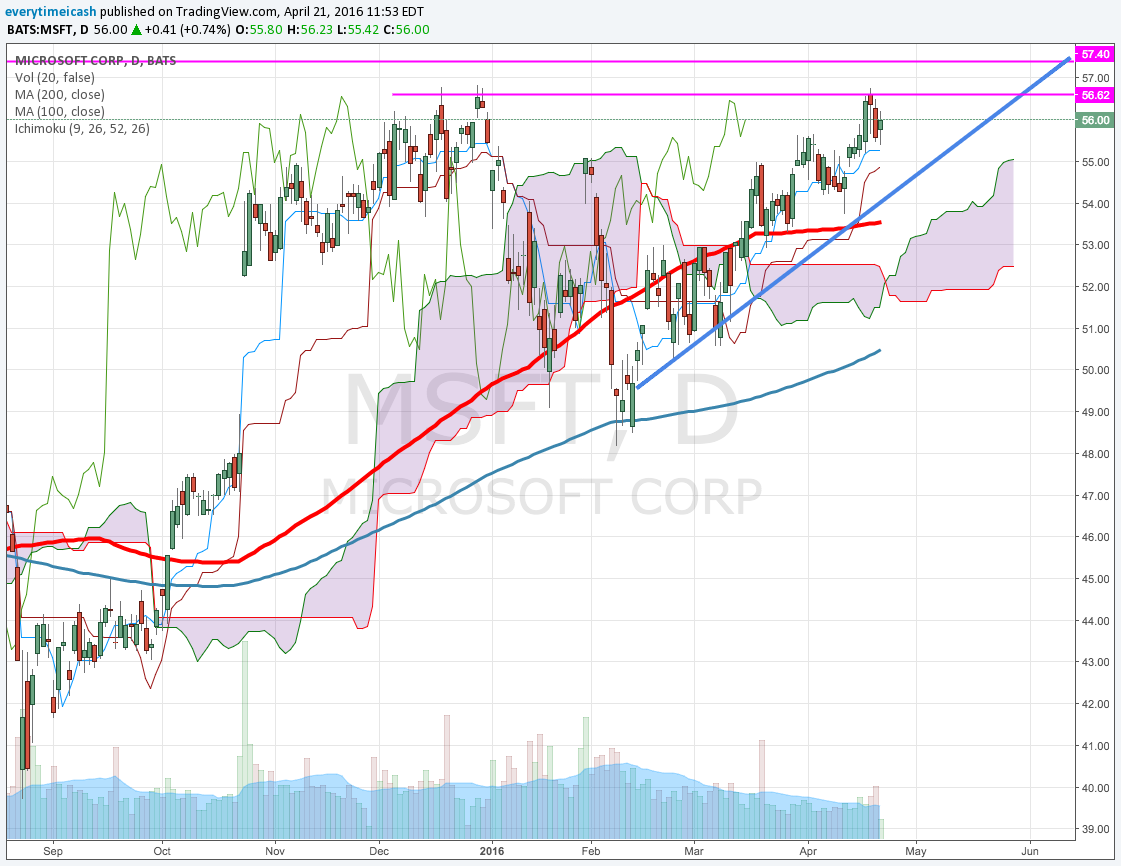
No matter how you slice it, this wasn't a good quarter for MSFT. As discussed in the trade packet, MSFT was a no touch as it was going into a report with lofty expectations, high IV, and into 20 year overhead supply (charts below). As expected, it traded back to the 100 day.

$GOOGL Me BRUH

$GOOGL Me BRUH

Alphabet (GOOG, GOOGL) is set to report Q1 results tonight after the close with a conference call to follow at 4:30pm ET. GOOG reported Q4 results at 4:01pm.

Current consensus is looking for EPS of $7.96 on Revenue of $20.38 bln.

KEY METRICS:


  • Revenue Growth- Q4 saw 18% which was a marked improvement from the prior three quarters (13.0%, 11.1%, 11.9%); Expectations are for another 18% y/y increase.
  • Non-GAAP Operating Margin- Increased to 32% in Q4. Google's Core margins were up 320 bps to 47%.
  • Aggregate paid Clicks- Q4 increased 22% q/q on Google websites.
  • Q4 Aggregate cost-per-click- Q4 was down 5% q/q in Q4.

Q4 Recap

GOOGL reported Q4 (Dec) earnings of $8.67 per share, $0.58 better than the Capital IQ Consensus of $8.09. Revenues rose 18.5% year/year to $21.33 bln vs the $20.76 bln Capital IQ Consensus.

Aggregate paid clicks- Q4 +31%; Q3 +23%.

  • Paid Clicks on Google websites- Q4 +40%; Q3 +35%.
  • Paid clicks on member sites- Q4 +2%; Q3 -5%.

Aggregate cost per click- Q4 -13%; Q3 -11%.

  • CPC on Google sites- Q4 -16%; Q3 -16%.
  • CPC on member sites- Q4 -8%; Q3 -4%.

Revenue Segments

  • Google Website revenue +20% y/y
  • Google Network Member websites +7% y/y
  • Google Advertising +17% y/y
  • Google Other Revenues +24% y/y
  • Operating Expense as % of revenue 36% compared to 37% in prior year
  • Free Cash Flow- $4.31 bln compared to $2.81 bln in prior year
  • TAC As a % of revenue- 21% compared to 22% in prior year.

Alphabet misses by $0.46, reports revs in-line

Reports Q1 (Mar) earnings of $7.50 per share, $0.46 worse than the Capital IQ Consensus of $7.96; revenues rose 17.4% year/year to $20.26 bln vs the $20.38 bln Capital IQ Consensus

Revenue Segments

  • Google Websites +20% y/y
  • Google Network Members' Websites 3%
  • Advertising Revenues +16% y/y
  • Google other revenues +24% y/y
  • Q1 Other Bets Revenue $166 mln; Operating Loss ($802) mln
  • Paid Clicks and Cost Per Clicks
    • Aggregate paid clicks- Q1 +29%;Q4 +31%; Q3 +23%.
      • Paid Clicks on Google websites- Q1 +38%; Q4 +40%; Q3 +35%.
      • Paid clicks on member sites- Q1 +2%; Q4 +2%; Q3 -5%.
    • Aggregate cost per click- Q1 -9%; Q4 -13%; Q3 -11%
      • CPC on Google sites- Q1 -12%; Q4 -16%; Q3 -16%.
  • CPC on member sites- Q1 -8%; Q4 -8%; Q3 -4%.
  • Q1 Free Cash Flow $5.23 bln
  • Q1 Effective Tax Rate 18%

It looks like expectations are growing as margins are contracting. This is not a good scenario for a growth company. The longer this goes the more likely the old google days are over.


Baking it In with Hal ($BHI $HAL Earnings Preview)

Baking it In with Hal ($BHI $HAL Earnings Preview)

Geographic Revenue Breakdown


  • North America -- 38.2% of total FY15 revenue
  • Latin America -- 11.4% of total FY15 revenue
  • Europe/Africa/Russia Caspian -- 20.8% of total FY15 revenue
  • Middle East/Asia Pacific -- 21.9% of total FY15 revenue
  • Industrial Services -- 7.7% of total FY15 revenue

Some of the most exciting news in this space in the past year was when Halliburton (HAL) announced an agreement which HAL will acquire all the outstanding shares of Baker Hughes (BHI) in a stock and cash transaction. 

In their last report, Halliburton said, "We are enthusiastic about and fully committed to closing the compelling BHI transaction, and remain confident we can achieve annual cost synergies of nearly $2 billion." BHI is the world's third largest oilfield services company. SLB is the largest and HAL is the second largest. 

Technicals

Technically, BHI remains in context of its downtrend off the 2015 highs, below its down-sloping 200-day moving averages (48/49). Energy as a whole has stabilized during Q1 of this year as Crude rallied back towards four month highs off the Feb lows.

BHI currenty sits along the top of its own 4-month range highs near the $47-area. A positive response to earnings will need to clear this resistance as well as the 200-day ma's above near 48/49. This would ignore more short covering. A negative response to earnings will liekly cause a test support near the 50-day ma's at 43/44, followed by its YTD range lows near 38/40.

HAL

Geographic Revenue Breakdown


  •  North America - 45.9% of total FY15 revenue
  • Latin America - 13.3% of total FY15 reveue
  • Europe/Africa -- 17.7% of total FY15 revenue
  • Middle East/Asia -- 23.1% of total FY15 revenue

In their annual report, Halliburton stated that the Baker Hughes acquisition may not be accretive, and may be dilutive, to their earnings per share in the near term.

A Technical Perspective

Technically, HAL has been on the mend off its January/February lows with a gain of more than 40%. It's recent upward momentum is clearing its longer-term downtrend line with price challenging resistance at the 40/41 area from the latter half of 2015. Expect price to push higher towards 45 on a positive response to earnings. A negative response will likely knock price back down towards the 36/37 followed by 34.

Options Activity

Based on HAL options, the current implied volatility stands at ~ 30%, which is 2% lower than historical volatility (over the past 30 days). Based on the HAL weekly Apr22 straddle, the options market is currently pricing in a move of ~2% in either direction by weekly expiration (Fri).

OIH WILL BE IMPACTED BY THE REPORTS

Rentin' a Winner $URI

Rentin' a Winner $URI

United Rentals beats by $0.21, beats on revs; guides FY16 revs in-line, reaffirms free cash flow guidance  

  • Reports Q1 (Mar) earnings of $1.40 per share, $0.21 better than the Capital IQ Consensus of $1.19; revenues fell 0.4% year/year to $1.31 bln vs the $1.29 bln Capital IQ Consensus.
  • For the first three months of 2016, free cash flow was $627 mln, after total rental and non-rental gross capital expenditures of $123 mln. By comparison, free cash flow for the first three months of 2015 was $450 mln after total rental and non-rental gross capital expenditures of $345 mln.
  • Co issues in-line guidance for FY16, sees FY16 revs of $5.6-$5.8 bln vs. $5.72 bln Capital IQ Consensus Estimate. Its prior outlook was for revenue of $5.65-$5.95 bln. Co reaffirms free cash flow guidance of $900 mln to $1.0 bln. Time utilization is expected to be approx. 68.3% compared to prior guidance of 68.0%.

F5! F5! F5!

F5! F5! F5!

F5 Networks beats by $0.05, reports revs in-line; guides Q3 EPS above consensus, revs below consensus; adds $1 bln to buyback  

  • Reports Q2 (Mar) earnings of $1.68 per share, $0.05 better than the Capital IQ Consensus of $1.63; revenues rose 2.5% year/year to $483.7 mln vs the $486.02 mln Capital IQ Consensus.
  • Co issues mixed guidance for Q3, sees EPS of $1.77-1.80, excluding non-recurring items, vs. $1.74 Capital IQ Consensus Estimate; sees Q3 revs of $490-500 mln vs. $502.72 mln Capital IQ Consensus Estimate. 
  • Board of directors had authorized an additional $1 billion for the company's common stock share repurchase program. This new authorization is incremental to the $73.8 million currently unused in the existing program which was initially authorized in October 2010. 
  • "Given the backdrop of a continued difficult macro and spending environment, I was pleased with our execution, as we delivered revenue within our guided range while maintaining solid profitability." said John McAdam, F5 President and Chief Executive Officer. "In addition, sales of our Better/Best software bundles, Virtual Editions, and Silverline subscription services all grew during the quarter as customers continued to embrace hybrid strategies and venture into public and private clouds."

Looks like $JNPR is isolated.

Golden Miner $NEM Earnings

Golden Miner $NEM Earnings

Newmont Mining beats by $0.15, beats on revs; provides 2016 production outlook 

  • Reports Q1 (Mar) earnings of $0.34 per share, excluding non-recurring items, $0.15 better than the Capital IQ Consensus of $0.19; revenues rose 3.0% year/year to $2.03 bln vs the $1.87 bln Capital IQ Consensus.

  • Attributable production totaled 1.23 million ounces, compared to 1.19 million ounces in the first quarter of 2015. During the quarter, higher production at Batu Hijau and Kalgoorlie and inclusion of CC&V more than offset declining production at Yanacocha and the sale of Waihi. Attributable copper production totaled 38,000 tonnes compared to 37,000 tonnes in the year ago period as Batu Hijau continued to mine higher grade ore.

  • Capital expenditures for the first quarter were $297 million, including $111 million of sustaining capital.

2016 Outlook:

  • Attributable gold production is expected to increase from between 4.8 and 5.3 million ounces in 2016 to between 5.2 and 5.7 million ounces in 2017, and remain stable at between 4.5 and 5.0 million ounces through 2020.

  • Attributable copper production is expected to be between 120,000 and 160,000 tonnes in 2016 and 2017 before decreasing to between 70,000 and 110,000 tonnes by 2018. The decline is due to the depletion of higher grade Phase 6 ore at Batu Hijau in 2018. Production at Phoenix Copper Leach and Boddington is expected to remain stable for the period.

  • 2016 sustaining capital is expected to be between $700 and $750 million increasing to between $800 and $900 million in 2017 to cover equipment rebuilds, water treatment and tailings storage facilities.


Sandy B $LVS Earnings

Sandy B $LVS Earnings

Las Vegas Sands misses by $0.18, misses on revs  

  • Reports Q1 (Mar) earnings of $0.45 per share, excluding non-recurring items, $0.18 worse than the Capital IQ Consensus of $0.63; revenues fell 9.8% year/year to $2.72 bln vs the $2.88 bln Capital IQ Consensus. EPS was $0.57 adjusted for Hold, or how lucky the casino was in terms of gambling win.
  • Hold-Normalized Adjusted Property EBITDA was $1.03 Billion - Consolidated Adjusted Property EBITDA was $917.6 Million
    • In Macao: Adjusted Property EBITDA was $510.4 Million - Strong Cost Discipline Drove a 190 Basis Point Improvement in Hold-Normalized Adjusted Property EBITDA Margin to 32.1%. "The operating environment in Macao remained challenging during the quarter; but we do see signs of stabilization, particularly in the mass market. Our focus on the higher margin mass and non-gaming segments and the geographic diversification of our cash flows enabled us to once again deliver in excess of one billion U.S. dollars of hold-normalized adjusted property EBITDA during the quarter... We remain confident that our market-leading Cotai Strip properties, which will be complemented later this year by The Parisian Macao, targeted to open in mid-September 2016, will continue to provide the economic benefits of diversification to Macao, help attract greater numbers of business and leisure travelers, and provide our company with an outstanding and diversified platform for growth in the years ahead."

WYNN Takes a hit after hours with the miss. 

Coke Head Happiness ($KO Earnings Preview)

Coke Head Happiness ($KO Earnings Preview)

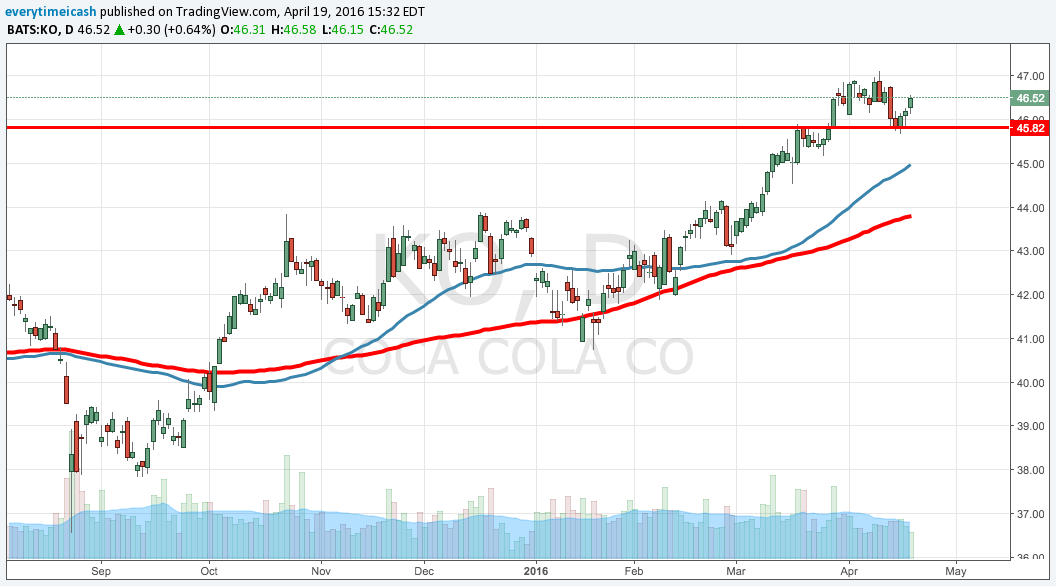
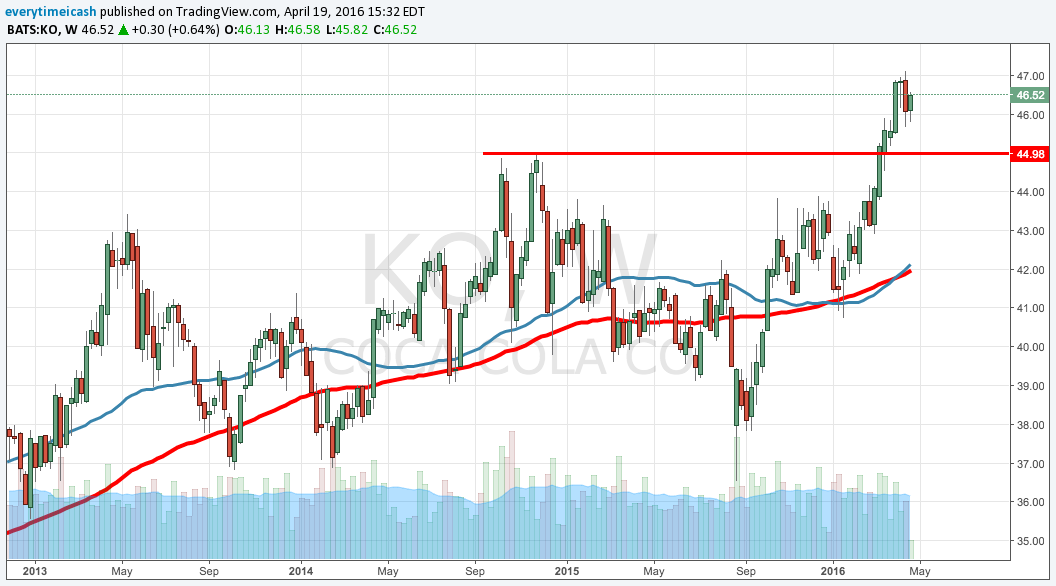
Coca-Cola (KO) is scheduled to report Q1 earnings tomorrow, before the opening bell, at 6:55 ET.

Current Consensus is for Q1 EPS of $0.44 (-8% Y/Y) on revenues of $10.2 bln (-5% Y/Y).

  • Current Consensus is for FY 16 EPS $1.95 on revs of $42.3 bln

  • Last quarter, KO beat EPS by $0.01/share w/ revs in-line. 

FY 16 Guidance from Last Q

  • Organic revs expected to grow 4-5%
  • Expects currency neutral income before tax, structurally-adjusted to grow 6-8% in 2016
  • Expects net impact of acquisitions and divestitures to be a four-five point headwind to net revs
  • Expect ~$2-2.5 bln in net share repurchases in 2016
  • Expect comparable currency neutral EPS growth of 4-6%
  • Expect to spend $2.5-3 bln on capex
  • Due to structural changes, co anticipates slightly higher COGS and SG&A
  • Co expect the benefit to equity income from Monster, Coca-Cola Beverages Africa and Coca-Cola European Partners to partially offset that impact at operating income, resulting in a three to four point negative structural impact to income before tax.
  • Look for updates on the below two l/t initiatives
  • $3 bln in productivity savings
  • Additional Notables from Last Quarter
  • Unit case volume was +3% YoY for Q4, and +2% YoY for FY 15
  • Global price/mix grew 2% for quarter and FY 15

TECHS


The stock price has been in a steady uptrend since, rallying bounce on the  50 day 3 times during the last quarter. The stock is currently up ~9% on the quarter and is near its 50 day.

Inside $INTC Earnings Release (4/19/16)

Inside $INTC Earnings Release (4/19/16)

Based on INTC options, implied volatility stands at ~ 25%, which is 57% higher than historical volatility (over the past 30 days). Based on the INTC Weekly Apr22 $31.50 straddle, the options market is currently pricing in a move of ~4% in either direction by weekly expiration (Friday).

Bank On It ($GS Earnings Preview 4/18)

Bank On It ($GS Earnings Preview 4/18)

GS reported Q4 (Dec) earnings of $4.68 per share compared to the Consensus of $3.62; revenues fell 5.5% year/year to $7.27 bln vs the $7.04 bln Consensus.


    Chill ($NFLX #Earnings 4/18/16)

    Chill ($NFLX #Earnings 4/18/16)

    Netflix ($NFLX) is set to report Q1 results tonight after the close with consensus at EPS of $0.03 on Revenue of $1.965 bln.